
🎯 Key Takeaways
In this module, we're building the groundwork for your trading success. By the time you're done, you'll walk away with:
- A clear, no-nonsense view of trading that cuts through the hype and sets you up for the long haul, not some overnight burnout.
- A solid risk management plan that keeps your money safe when things get rough and helps it grow when the market's in your favor.
- The skill to read market structure through price action, no lagging indicators needed, on any timeframe you choose.
1.1 Introduction to the Trading Journey
Let's kick things off by tackling some big misconceptions. You've probably scrolled through social media and seen traders showing off their millions, posing with fancy cars in Dubai, and talking up this "free" lifestyle. It's easy to fall for the idea that trading is a fast track to wealth. But here's the truth: trading isn't quick or easy. It takes a ton of time to get good at it, and you'll stumble plenty before you start seeing steady profits.
I'm not here to sell you some magic formula that'll make you rich by tomorrow morning, because that's just not real. What I will do is share proven steps to level up your trading, guiding you from struggling newbie to a disciplined pro.
Setting Realistic Goals
So, let's talk goals. You can finish this course in about 30 to 60 days. While you're working through it, I'd suggest paper trading to test out what you're learning without risking your cash. Once you've got the hang of it, switch to real money, either in your own account or a funded one. Just don't linger too long on paper trading. It feels different when real dollars are on the line, and you don't want to build fake confidence that crumbles when emotions kick in.
Here's the thing: if you paper trade for, say, six months and rack up wins, jumping to real money can still throw you off. Losses hit harder when they're real. After about 6 to 12 months of active trading, you should notice progress compared to your first 90 days. For bigger goals, like 1 to 5 years down the road, set targets that fit your life, but keep them grounded. Starting with $100 isn't going to make you a millionaire in five years, and that's okay.
1.2 Trading Psychology Fundamentals
Understanding Your Personal Trading Psychology
Before we get into the nitty-gritty of strategies, let's figure out what makes you tick as a trader. Your personality, your schedule, your comfort zone—all of that shapes how you'll trade. Ask yourself a few things:
- Can you spend a chunk of your day trading?
- Do you like quick wins, or are you cool holding trades for days?
- How much risk can you stomach without losing sleep?
Be honest. Your answers will point you toward a trading style that fits you, which is key for staying consistent and keeping your cool.
| Trading Style | Time Commitment | Trade Duration | Risk Tolerance | Best For |
|---|---|---|---|---|
| Scalping | Very High (3-5+ hours daily) | Minutes | High | Detail-oriented traders who can make quick decisions, handle stress well, and don't mind intense screen time |
| Day Trading | High (2-4 hours daily) | Hours | Medium-High | Traders who want to avoid overnight risk, can dedicate specific hours daily, and can handle moderate stress levels |
| Swing Trading | Medium (1-2 hours daily) | Days to Weeks | Medium | Traders with other commitments who prefer more analysis time, can handle positions being open overnight, and prefer moderate risk |
| Position Trading | Low (A few hours weekly) | Weeks to Months | Medium-Low | Patient traders who prefer fundamental analysis, can emotionally detach from short-term fluctuations, and have longer-term outlook |
Start by paper trading your pick, and pay attention to how it feels, not just the results. If a style doesn't click with your life, it'll stress you out and mess up your decisions. You can even mix styles. I do a bit of day trading, scalping, and position trading myself.
Common Psychological Traps and Biases
Now, let's talk about the mind games trading plays on you. First up is loss aversion. Losses sting way more than wins feel good. Ever notice how you:
- Cling to losing trades, praying they'll bounce back?
- Cash out winners too fast, scared they'll flip?
- Freeze up on good setups after a loss?
- Set stop losses so tight you get kicked out early?
💡 Try this:
Write down how you feel after a win and a loss of the same size. You'll see the difference.
Stick to your plan—your take-profit and stop-loss levels aren't suggestions. Next is confirmation bias. You latch onto stuff that backs up your hunch and ignore the rest, like:
- Only watching indicators that agree with you.
- Brushing off signals that say you're wrong.
💡 Try this:
Before a trade, look for reasons you might be off. It'll sharpen your decisions.
Then there's recency bias, where the latest trades mess with your head. You might:
- Judge everything by your last few results.
- Skip solid setups because the last one flopped.
- Overtrade after a hot streak.
- Get narrow-minded about the market.
💡 Try this:
Check your journal. Winning and losing streaks happen—it's normal. Every trade's a fresh start; two losses don't mean the third's doomed.
Recency ties into two more traps. Overconfidence after wins can make you:
- Bet too big.
- Take shaky setups.
- Think you're a genius when luck's on your side.
And revenge trading after losses pushes you to:
- Ditch your plan.
- Throw big money at trades to "win it back."
💡 Try this:
Take a breather after big wins or losses. Cool off before jumping back in. It's like gambling—don't double down thinking you're "due" for a win. Each trade stands alone.
Mental Resilience for Trading
Here's how to stay sharp mentally:
- Check yourself: Before trading, ask, Am I tired? Stressed? If you're off, skip it. Trading needs focus.
- Plan ahead: Mark your key zones on the chart, decide your moves. It saves you from winging it mid-session.
- Stay focused: Keep your space clear, no phone distractions. You don't want to miss a trade because of a TikTok scroll.
- Step back: After entering a trade, take a 15-30 minute break. Walk away, clear your head.
Outside trading, hit the gym, hang with friends, keep life balanced. The market's not going anywhere—don't let it take over.
💡 Try this:
Set up "circuit breakers." Like, "If I feel FOMO, I'll close my platform for 10 minutes." Pick three triggers and limits (money or emotional) to stop your day. Test them over five sessions.
1.3 Risk Management Basics
Risk management is everything in trading—it's what keeps your account alive. Forget obsessing over perfect entries; this is what pros nail and amateurs skip. It's not just about dodging losses; it's about surviving the bad runs and thriving in the good ones. Even top systems lose sometimes—without this, you're toast.
A so-so strategy with great risk management can make money. A killer strategy with no plan? Done.
Fixed Percentage Method
You've heard the rule: risk 1% of your account per trade. It's standard advice, but it's not set in stone. It depends on what you're trading. For prop firms like Topstep, 1% can sink you fast. Say you've got a $50,000 account with a $2,000 drawdown limit. Four losses at $500 each, and you're out.
Key points:
- The 1-2% thing is a guideline—tweak it for your setup.
- Prop firms with tight limits? Try 0.25-0.5% instead.
- Example: $50,000 account, $2,000 max drawdown, 0.5% ($250) risk means eight losses to hit the limit.
Even with your own cash, think about what drawdown you can take. Can't handle 10%? Then 2% per trade is too much. Use data, not rules, to figure it out.
💡 Try this:
I've got a Trading System Analyzer. Plug in your numbers: account size, win rate (30-60% is normal), average win/loss, trades per day, max drawdown (say 10%), daily loss limit (like 2%). Run it 100-1,000 times. If you're busting your drawdown too often, cut your risk.
This keeps you in the game long-term, not chasing wild gains that crash in months.
Drawdown Recovery Methods
When losses pile up, I scale back like this:
- At 25% of max drawdown: Cut position size by 25%.
- At 50%: Down 50%.
- At 75%: Down 75%, or just pause.
So, if your normal size is 100 shares:
| Drawdown | Position Size |
|---|---|
| 25% of max drawdown | 75 shares |
| 50% of max drawdown | 50 shares |
| 75% of max drawdown | 25 shares |
It's a system to avoid blowing up. Smaller bets in a slump keep losses low till the market turns.
Other Position Size Methods
I don't use these, but here's a quick look:
- Kelly Criterion: Uses your win rate and average win/loss to size bets. It can spit out crazy risks, like 10%, and a few losses kill you. Even toned-down versions feel dicey to me.
- Scaling In: Adding to winners or losers. Risky—either piles on losses or gives back gains when the market flips.
I stick to fixed percentage—it's safer.
1.4 Market Structure Essentials
Understanding Price Action
Price action is the heart of trading. It's raw supply and demand, no lagging indicators like moving averages muddying things up. Markets aren't random—they're all about what people are doing. Get this, and you've got an edge.
- Bullish conviction: Prices shoot up, barely pulling back. Buyers are running the show.
- Bearish conviction: Hard drops, weak bounces. Sellers own it.
- Indecision: Choppy, messy bars in a range. No one's in charge.
- Exhaustion: Moves slow down at peaks or lows, hinting at a flip.
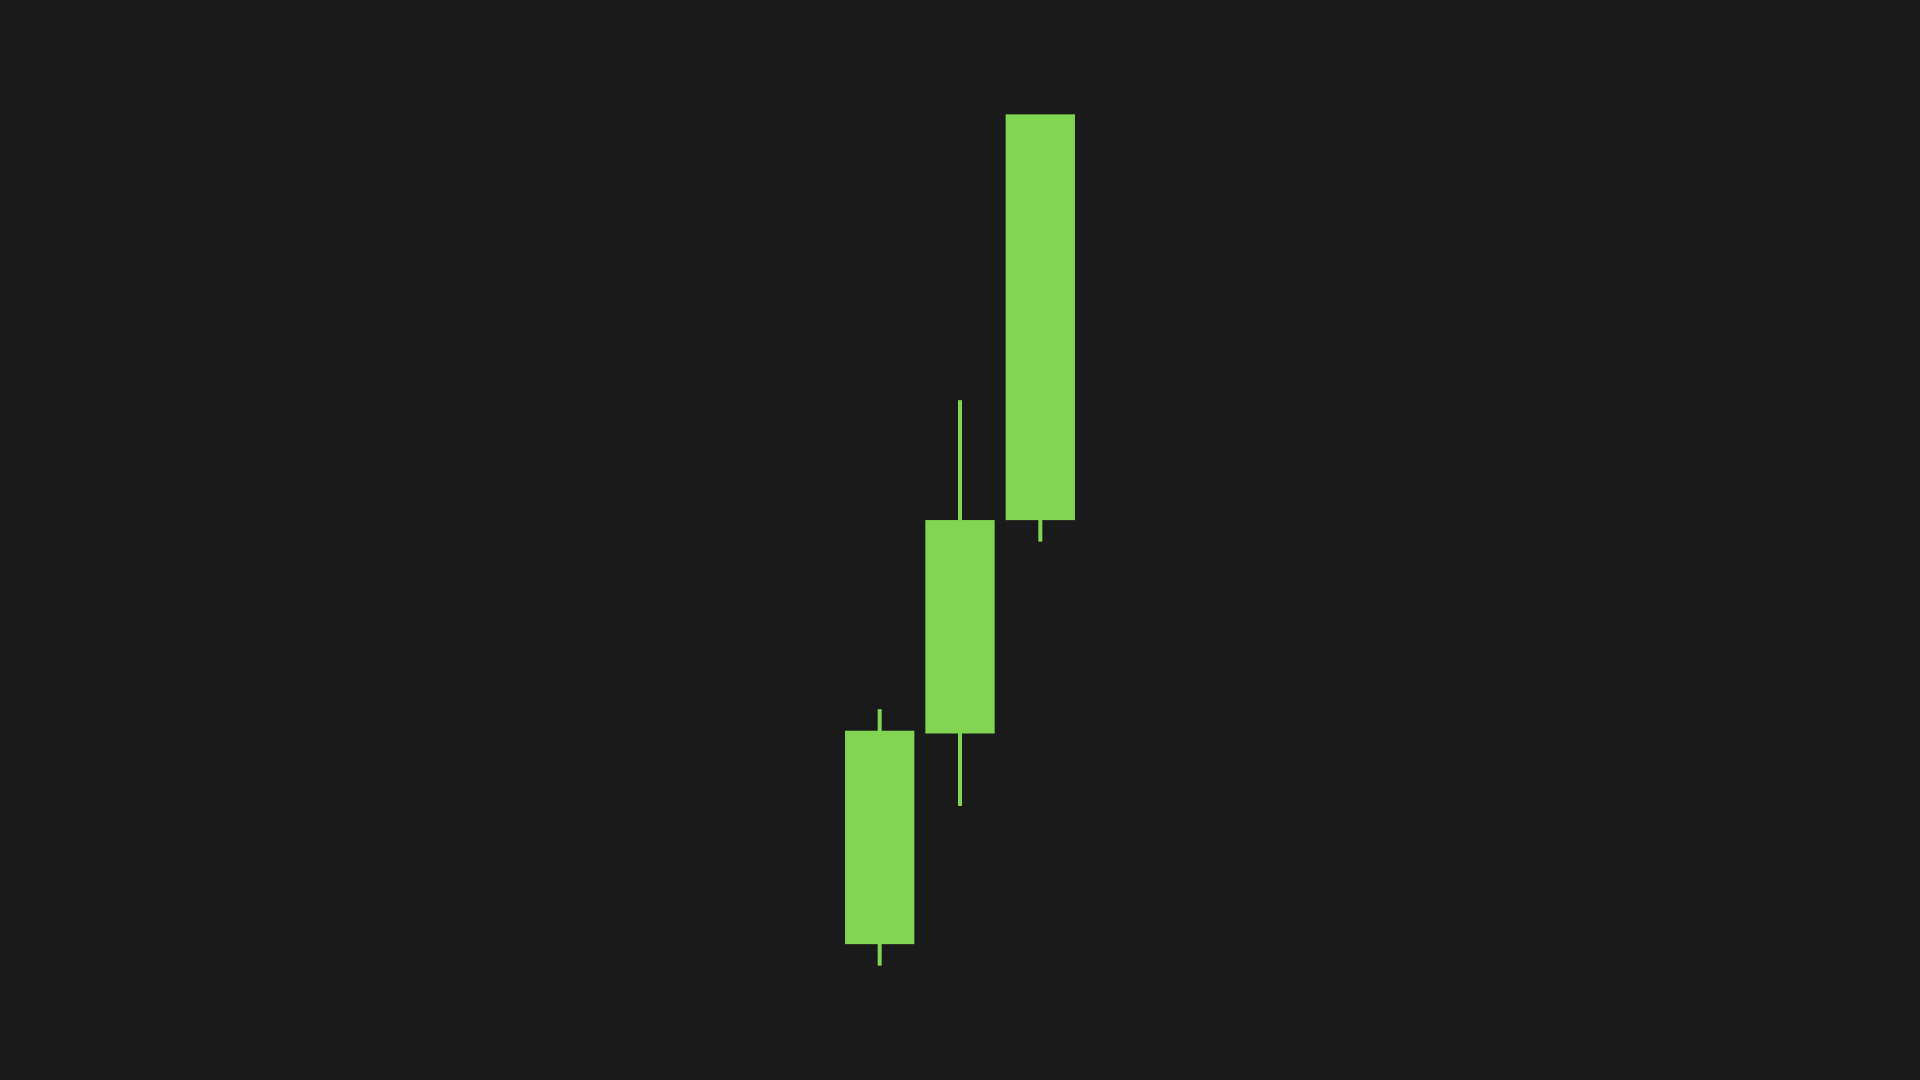
Bullish conviction example
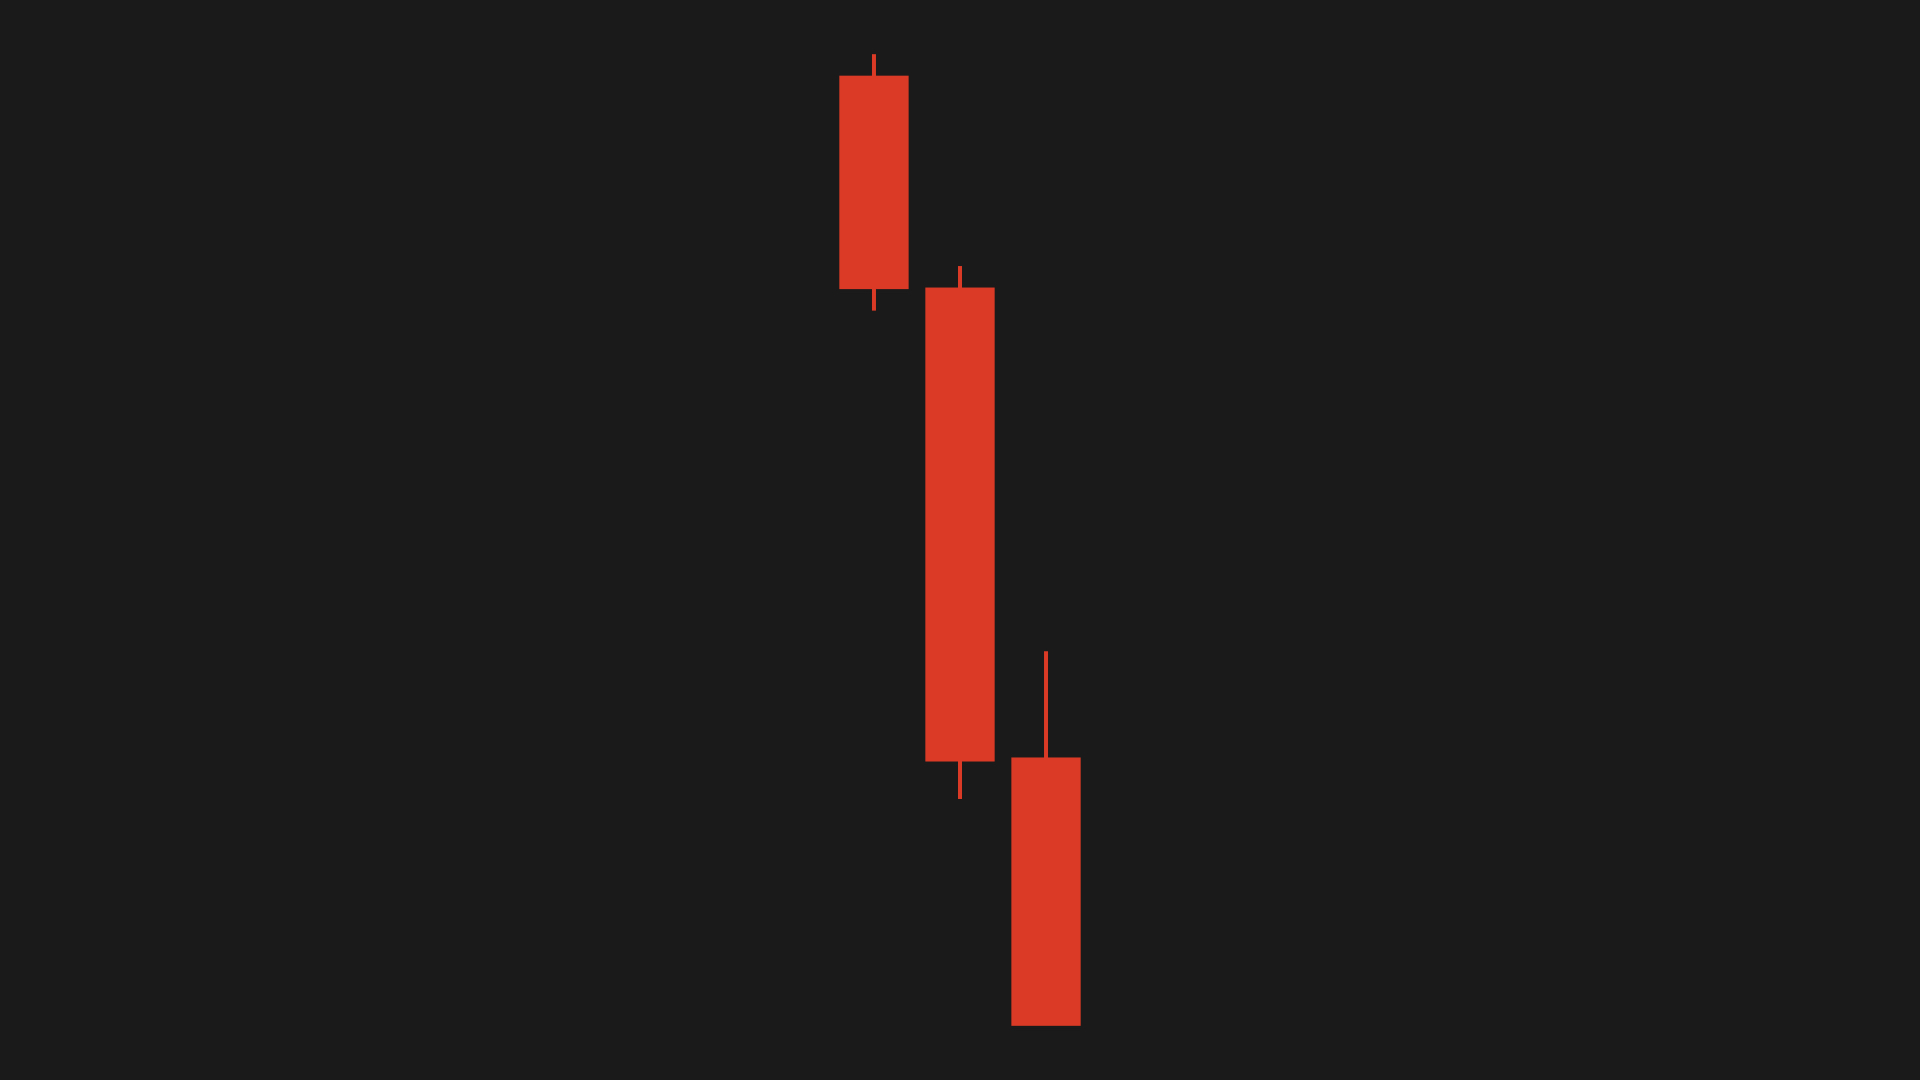
Bearish conviction example
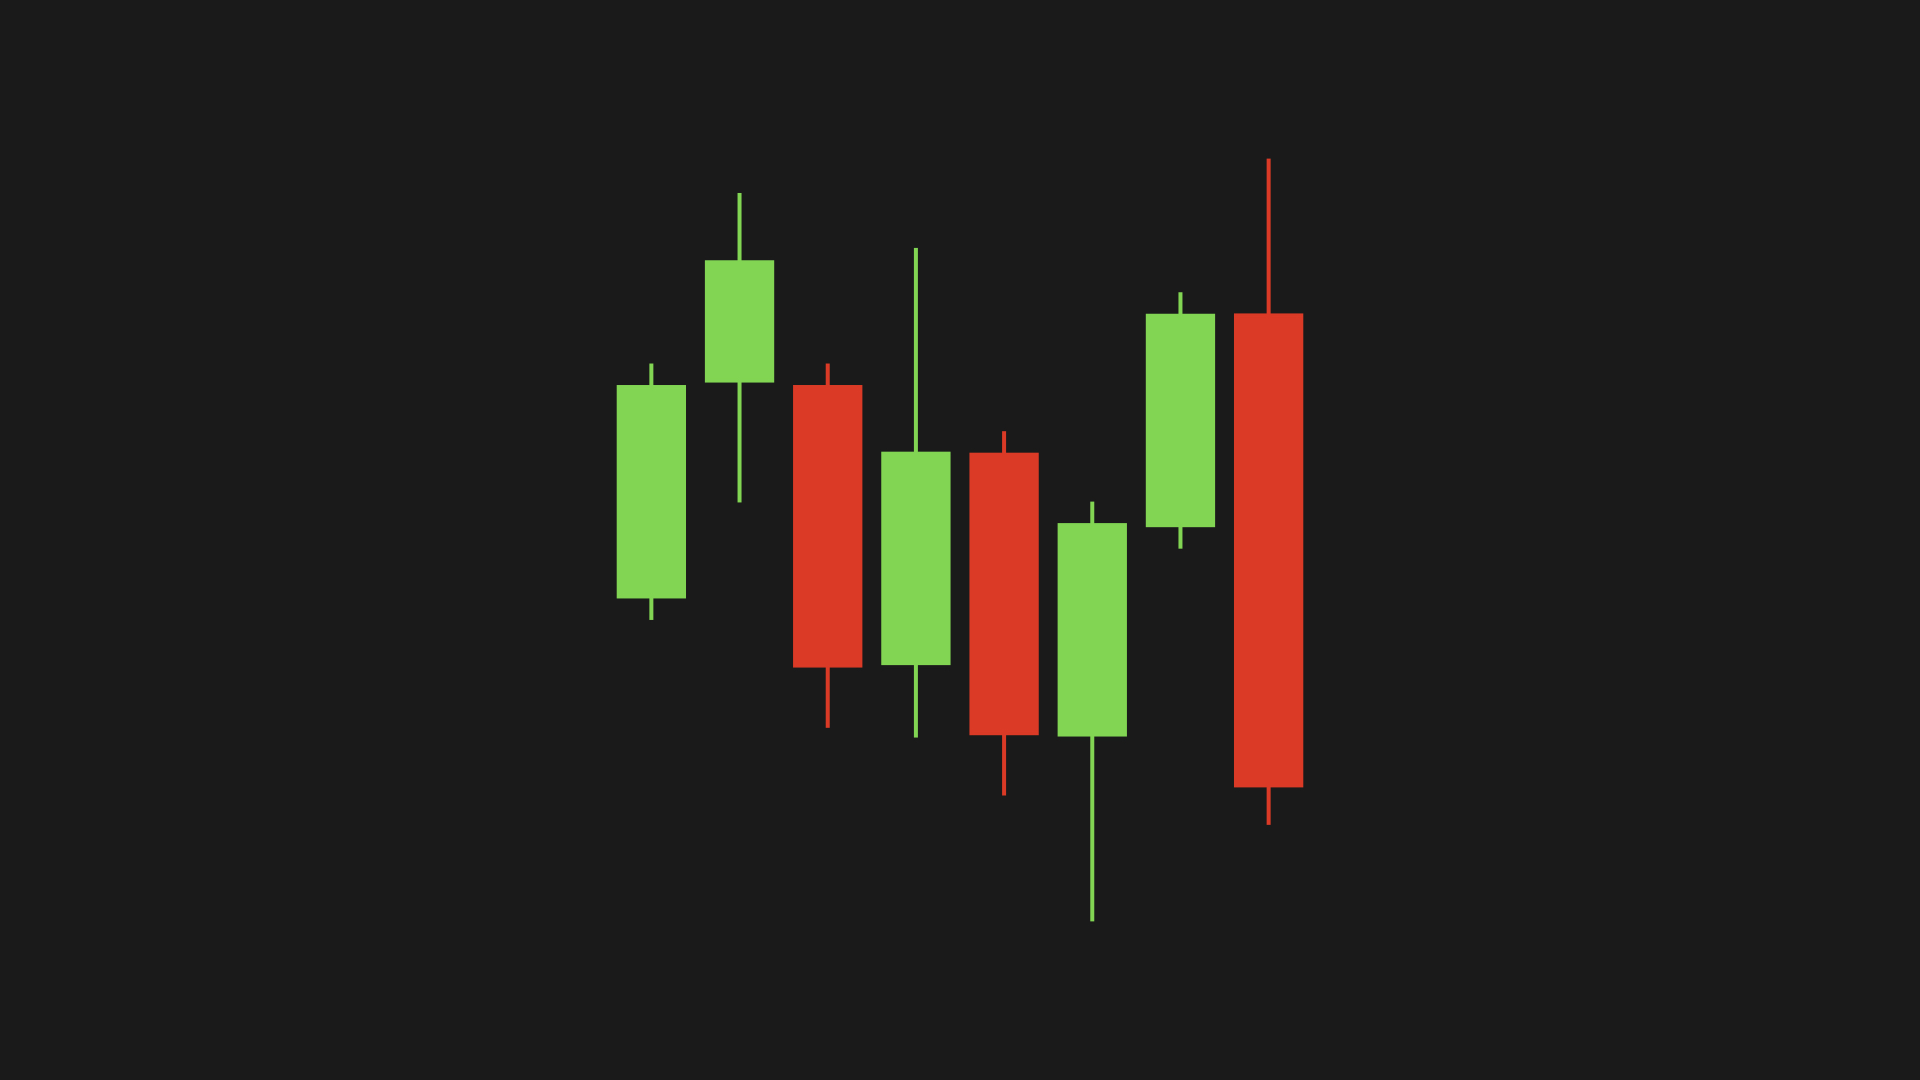
Indecision example
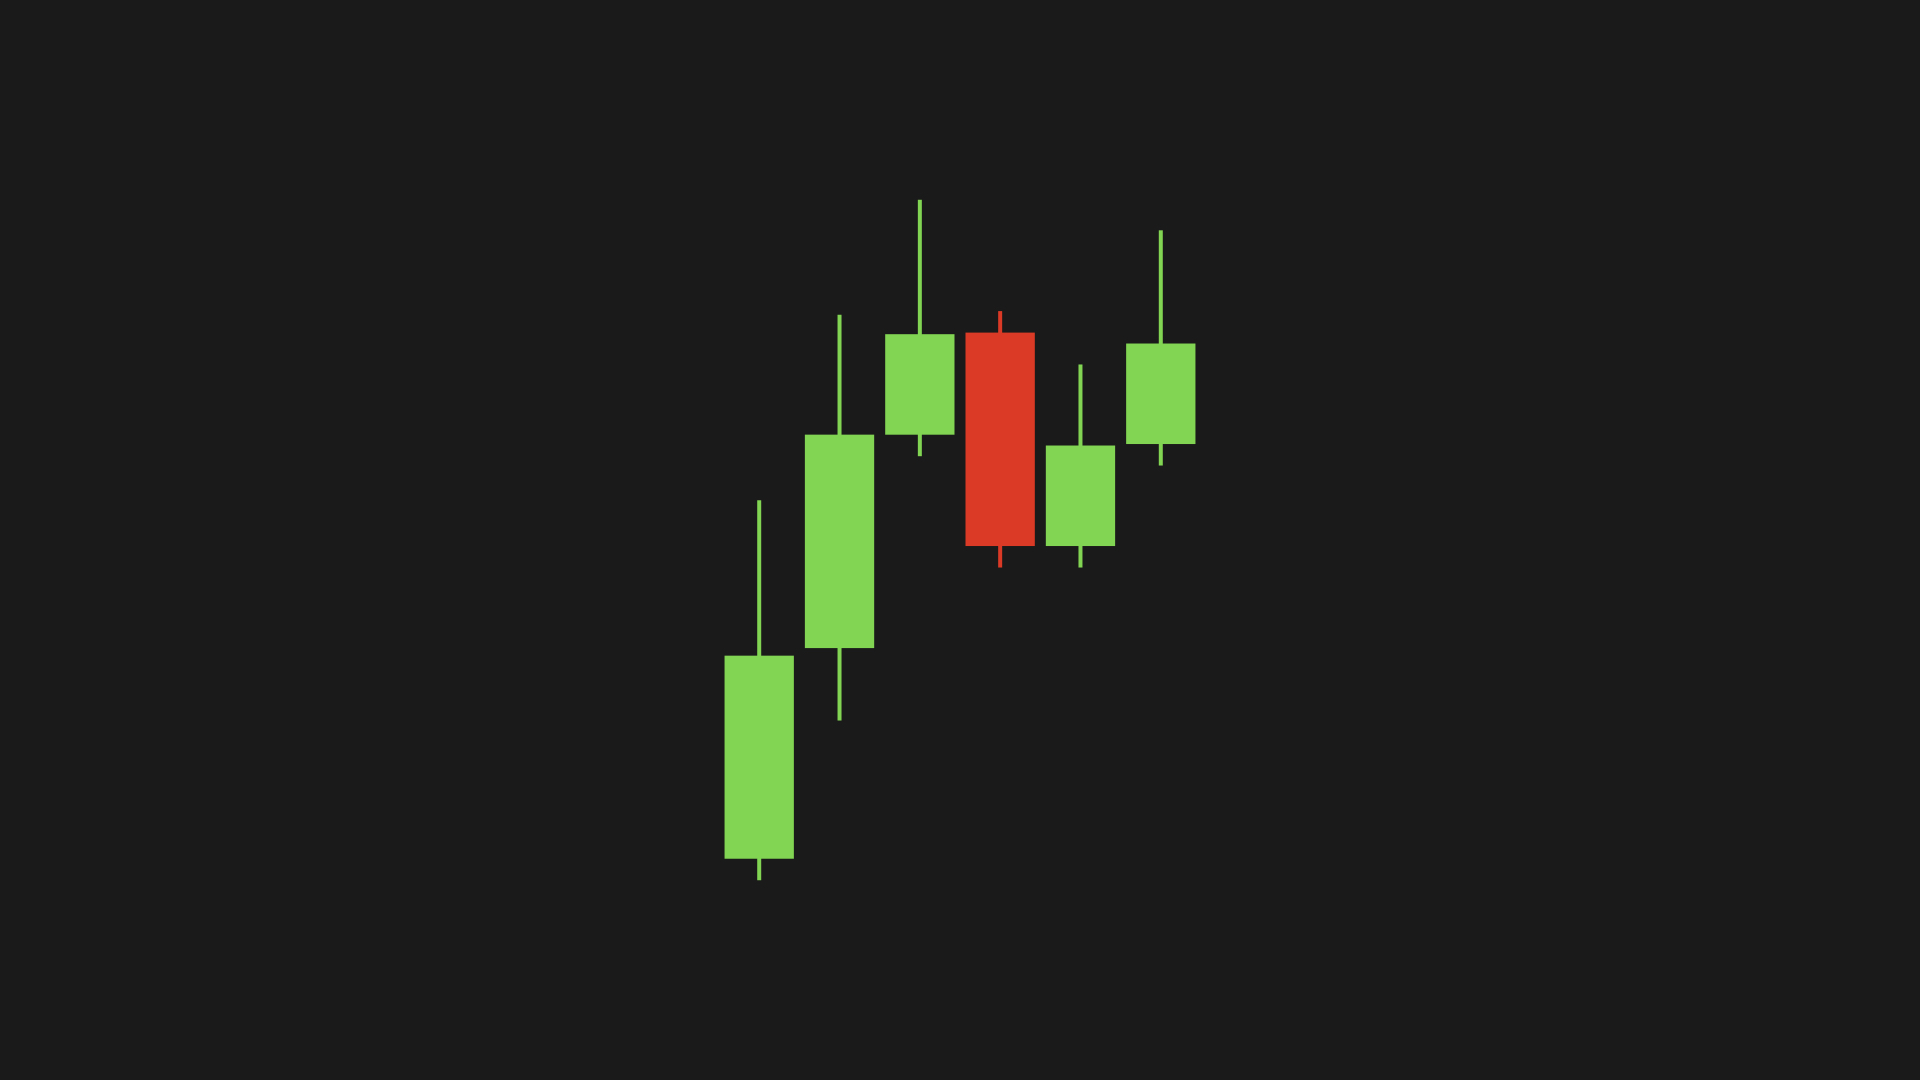
Exhaustion example
Price Rejection vs. Absorption
How prices act at big levels tells you a lot:
- Rejection: Hits a level, bounces fast. Long wicks show someone's fighting hard.
- Absorption: Hangs out, small candles. Supply and demand are duking it out.
- Acceptance: Breaks through, stays put, often retests. Momentum's taken over.
Price rejection example: price hits key levels and reverses hard
Price absorption example: price stalls at a level, consolidates
Price acceptance example: breaks level and holds strong
Volume Confirmation
Volume backs up what prices say:
- Prices up, volume up: Bulls are strong.
- Prices up, volume down: Watch out, might reverse.
- Big volume spikes: Market's tired or panicking.
- Quiet volume in a range: Breakout's coming.
| Price Action | Volume Pattern | Market Signal |
|---|---|---|
| Rising | Increasing | Strong bullish trend |
| Rising | Decreasing | Potential reversal ahead |
| Sideways | Decreasing | Breakout likely approaching |
| Any Direction | Sharp Spike | Market exhaustion/capitulation |
Trading takeaways:
- Volume matches price direction: Trade with confidence.
- Volume disagrees: Be careful, reversal's possible.
- Low volume in a lull: Get ready to move.
- Spikes: Look for a turn.
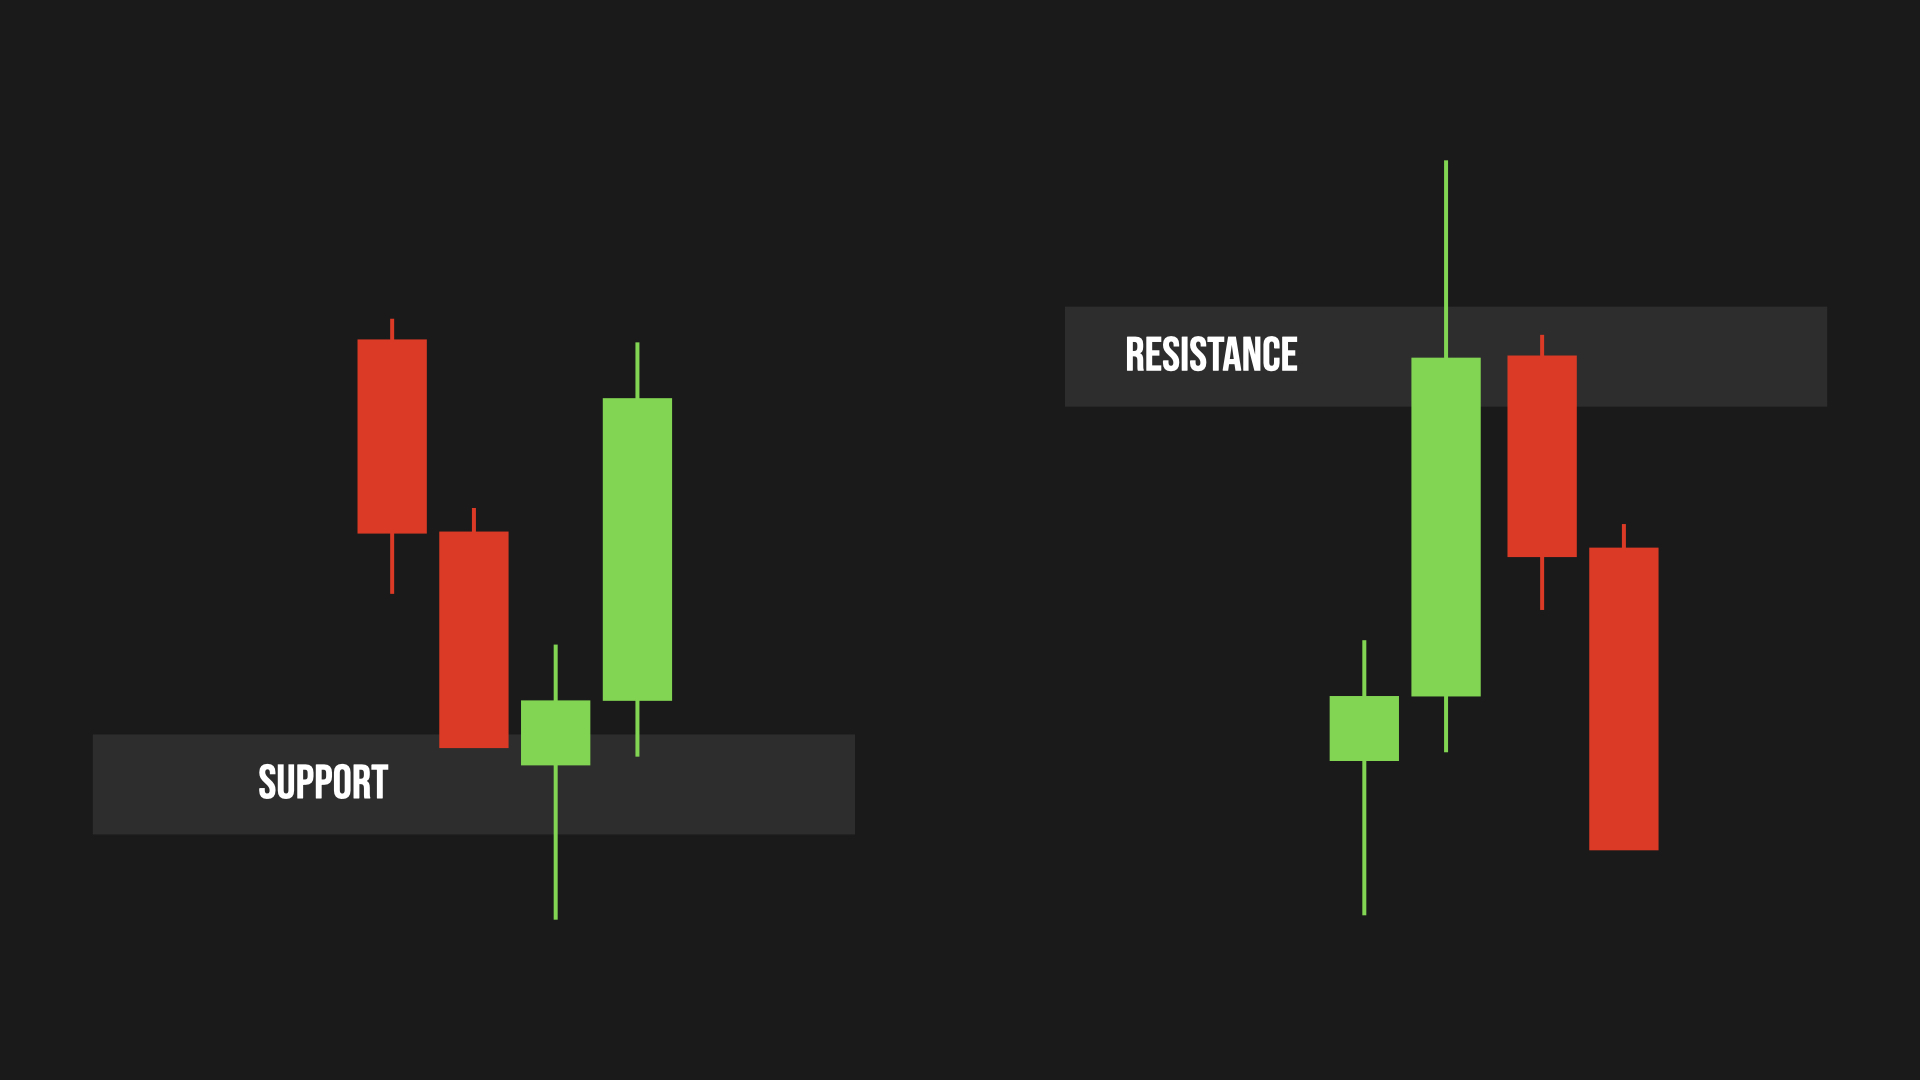
Support and Resistance Fundamentals
Support and resistance are where buyers and sellers clash. They're barriers—price stalls there until one side gives up, letting the other push through. You'll spot them at:
- Round numbers: 1200, 10000, 10.
- Old highs/lows: Past extremes stick around.
- Big swings: Long-lasting zones.
- Recent swings: Matter more short-term.
- Clusters: Multiple hits in one spot.
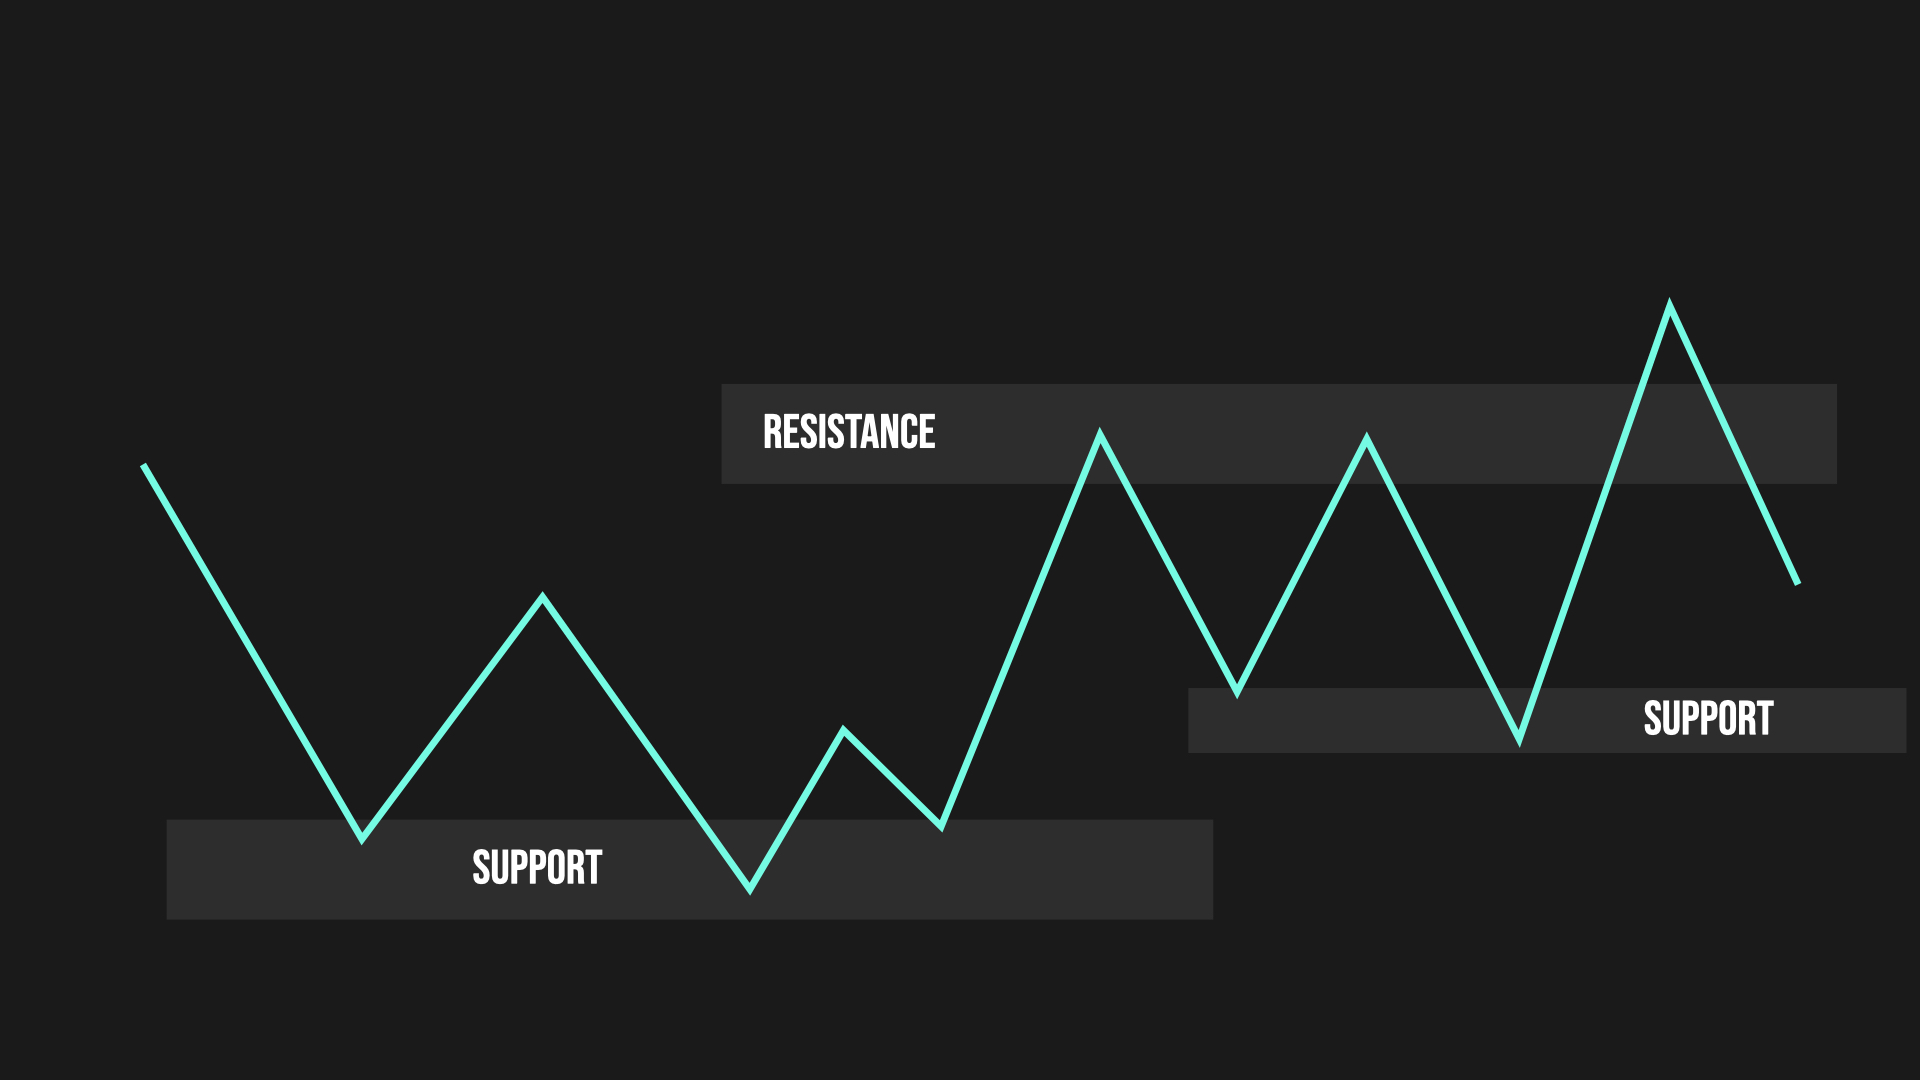
Support and resistance example
Markets aren't perfect, though. Price might poke past a zone, trigger your stop, then go your way. It happens.
Key Candlestick Patterns
Not all patterns matter, but these do:
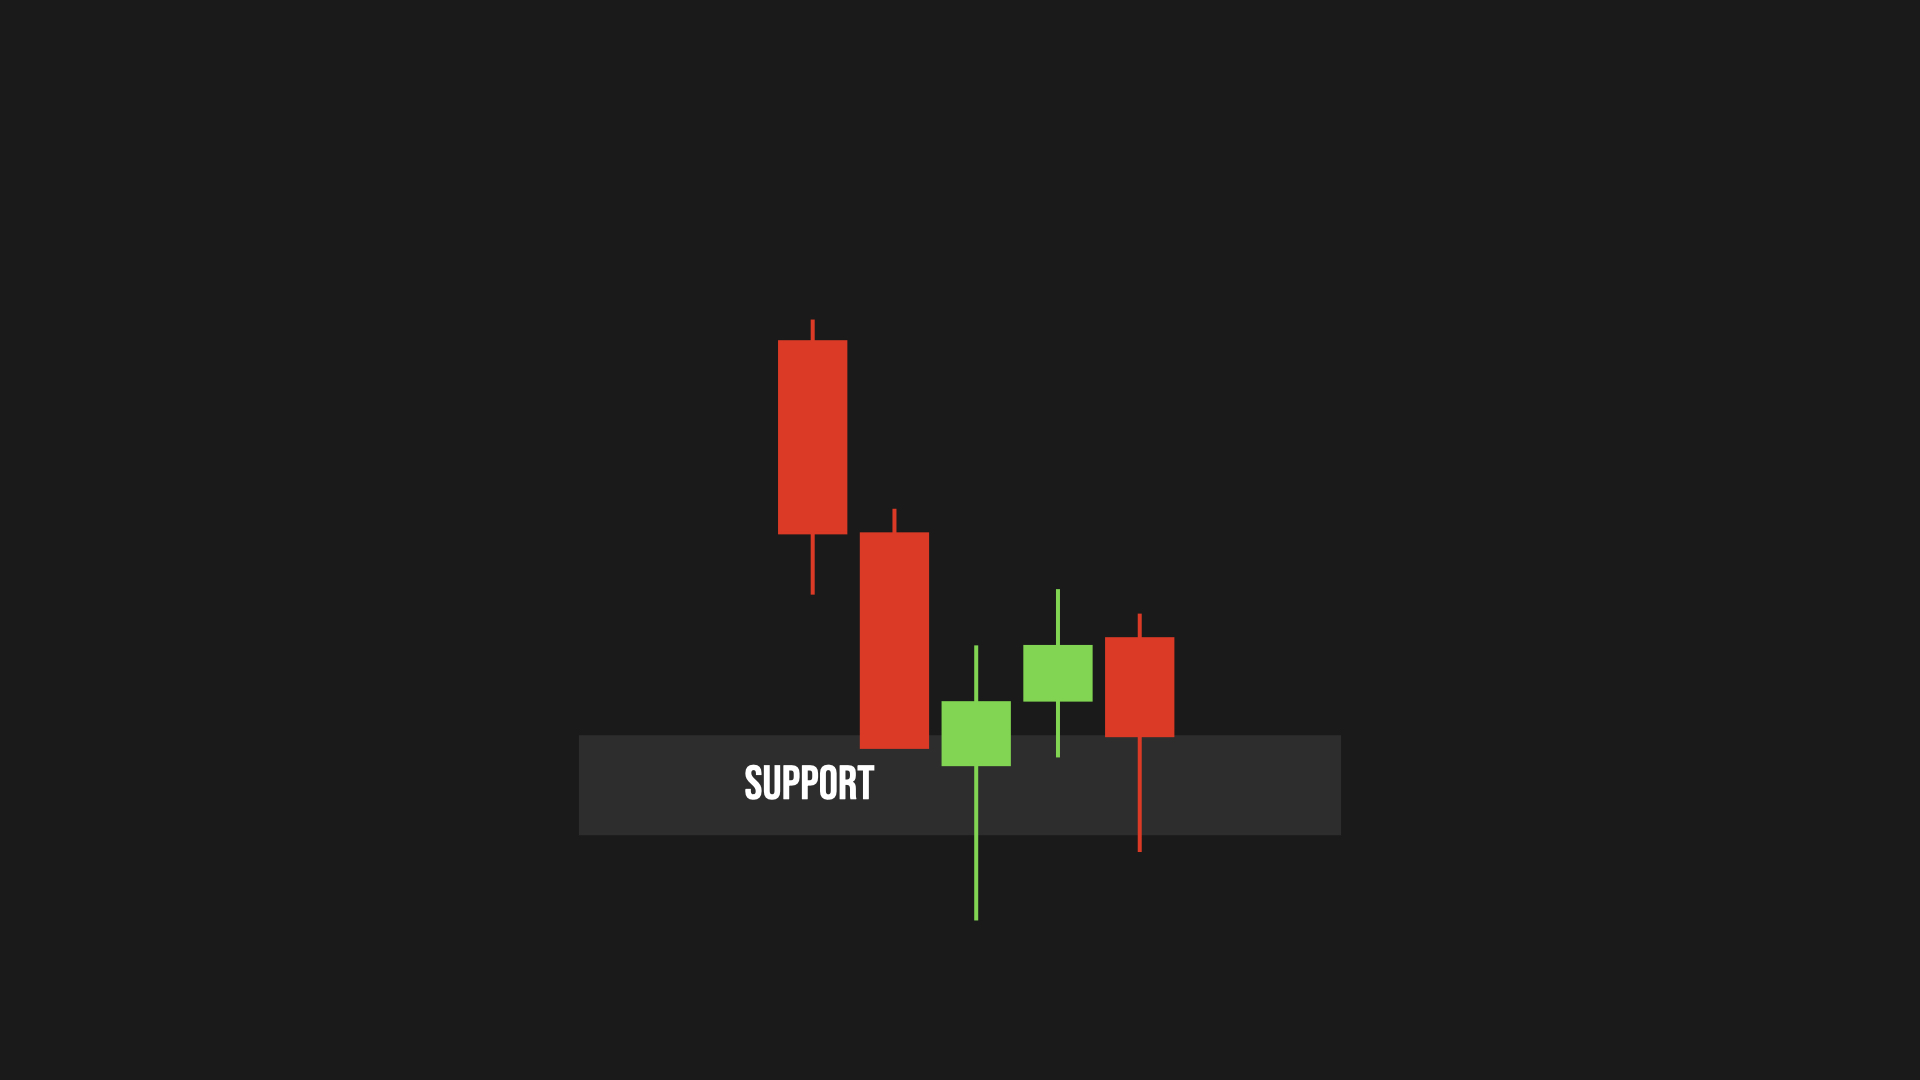
- Engulfing patterns at key levels: A big candle swallows the last one. At support, a green one eating a red one says buyers are in. At resistance, red over green means sellers win.
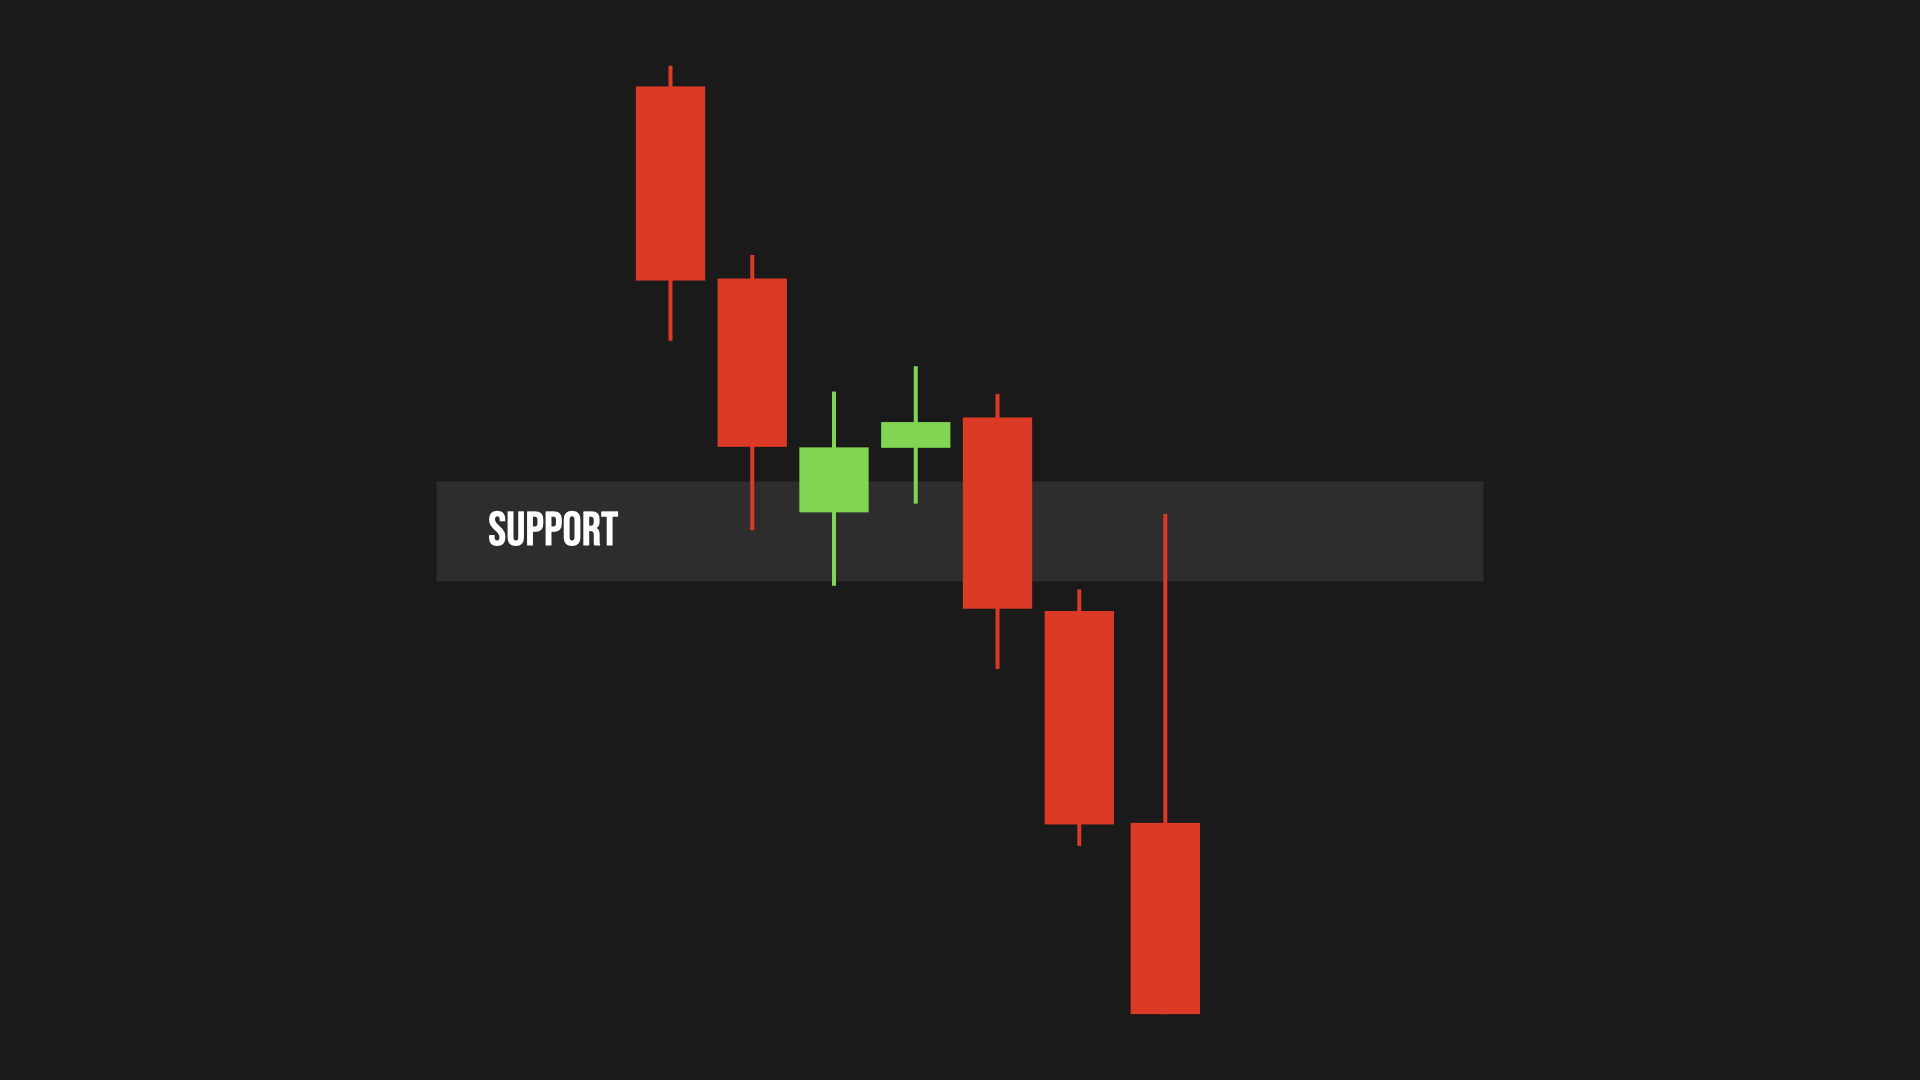
- Pin bars (hammers/shooting stars): Long wick, small body. At support, a lower wick says buyers fought back. At resistance, an upper wick shows sellers pushed down.
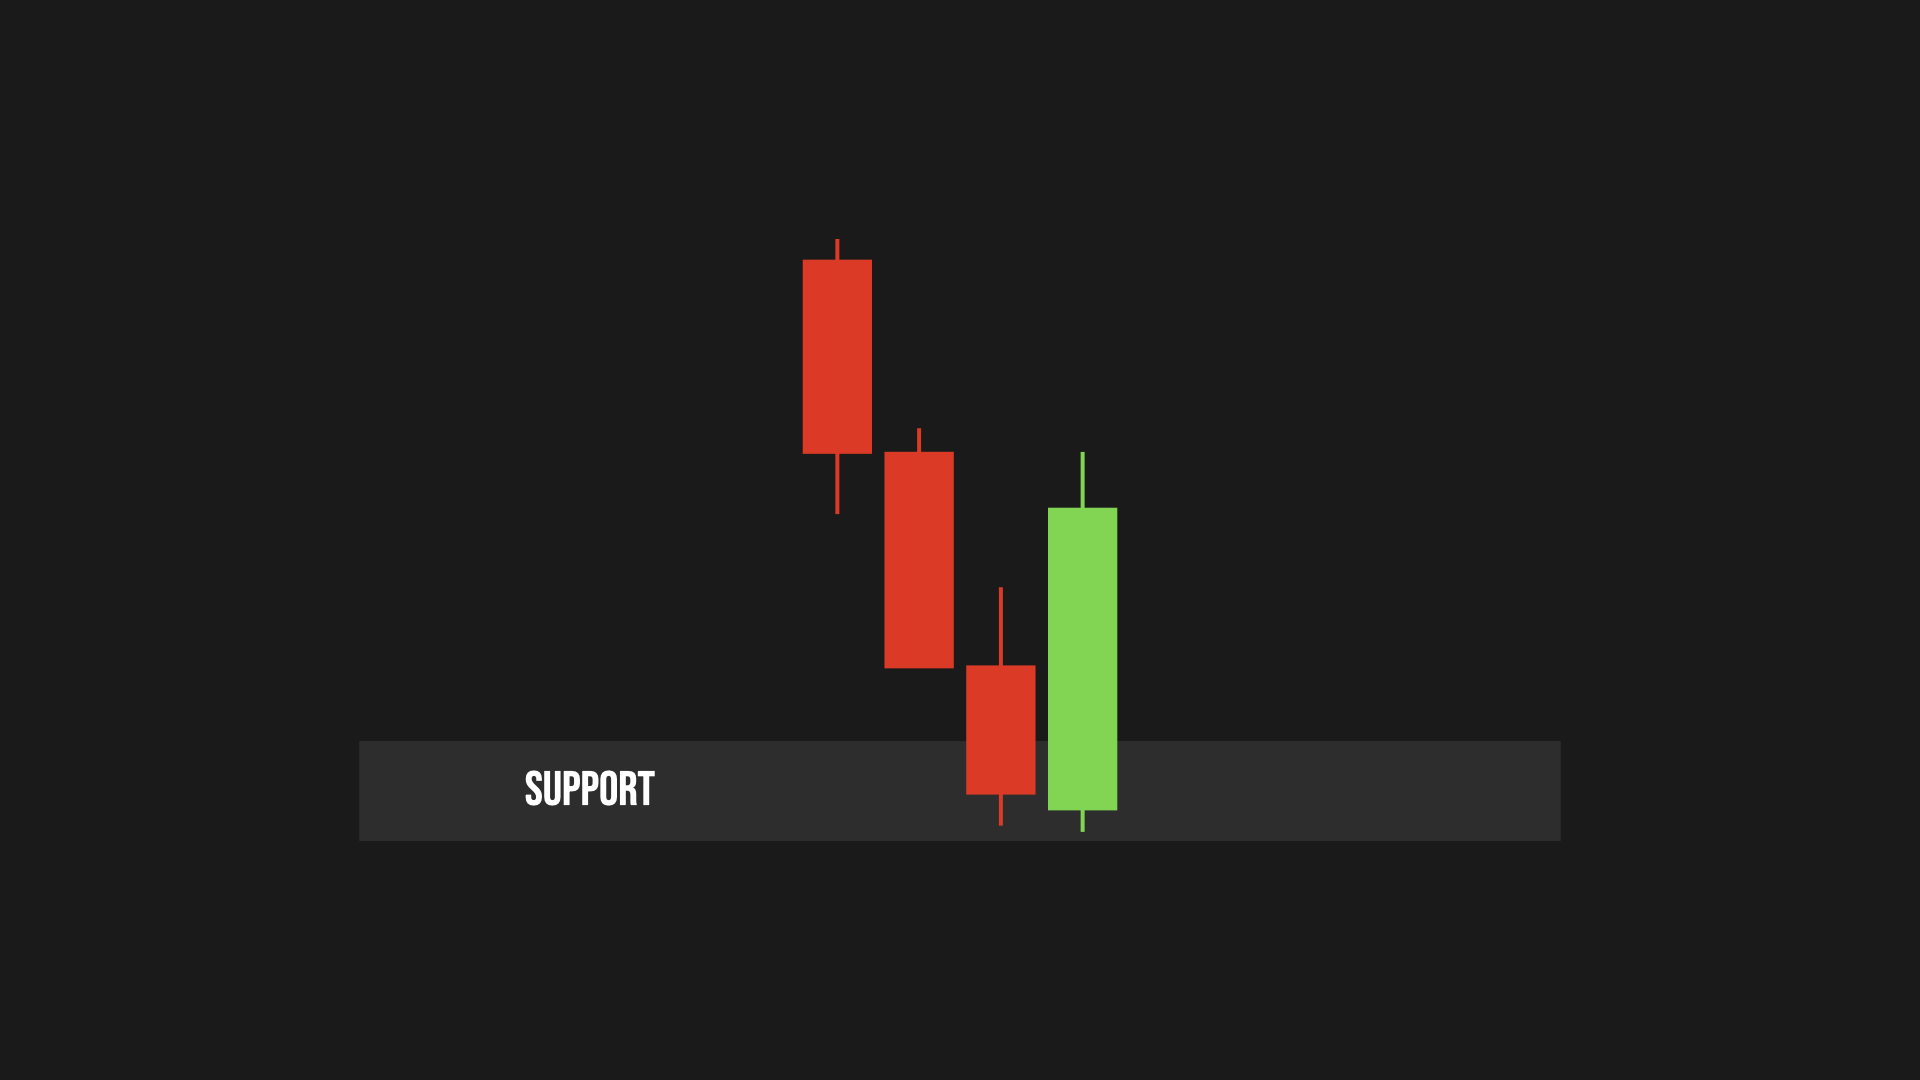
Engulfing pattern: green candle engulfs red at support
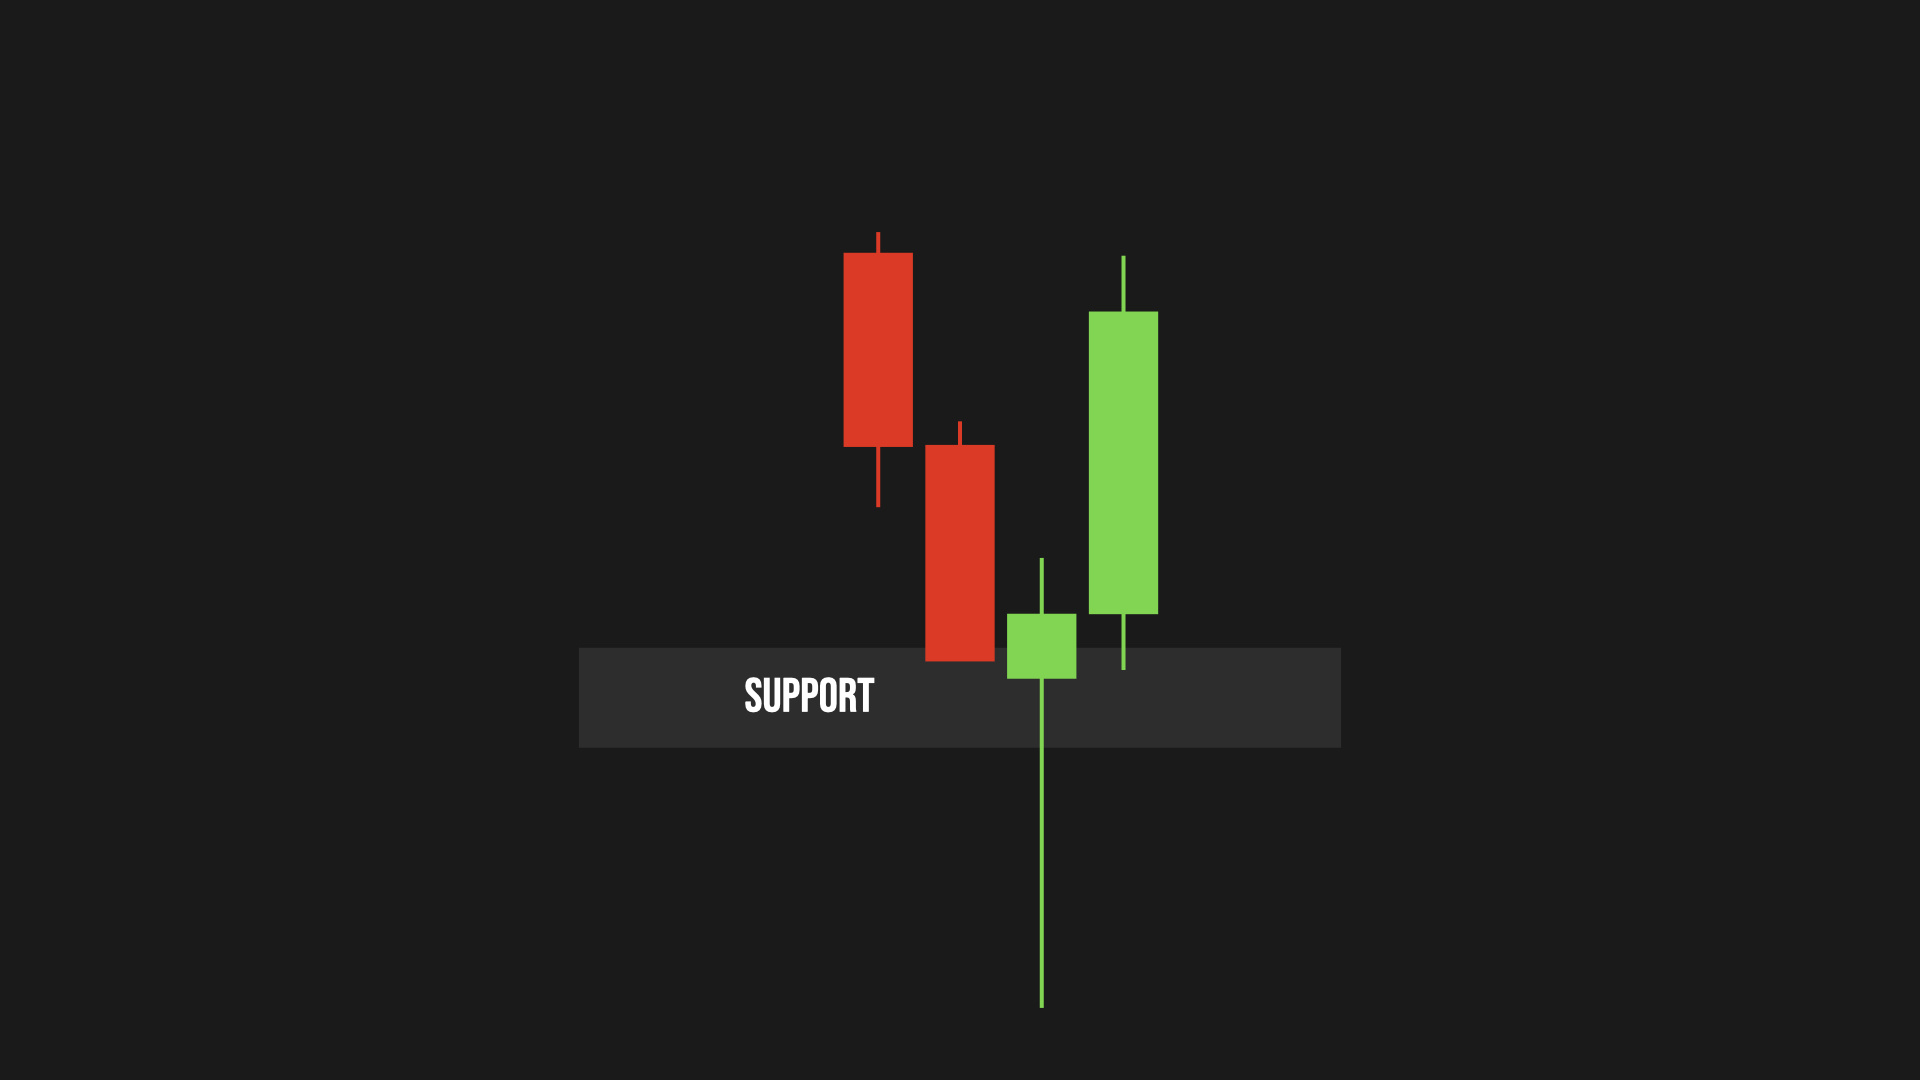
Pin bar at support with long lower wick
Other patterns like doji or morning star? Just twists on these. They show who's winning at big levels. Strong rejection often means the trend's shifting. Don't sweat memorizing them all—just watch the chart. Big bodies mean momentum, long wicks mean rejection.
Market Phases and Conditions
Markets loop through four phases:
- Accumulation: Flat after a downtrend, no direction.
- Uptrend: Starts slow from accumulation, builds higher lows, breaks out.
- Distribution: Flat after an uptrend, stalling out.
- Downtrend: Breaks below distribution, failed retests confirm it.
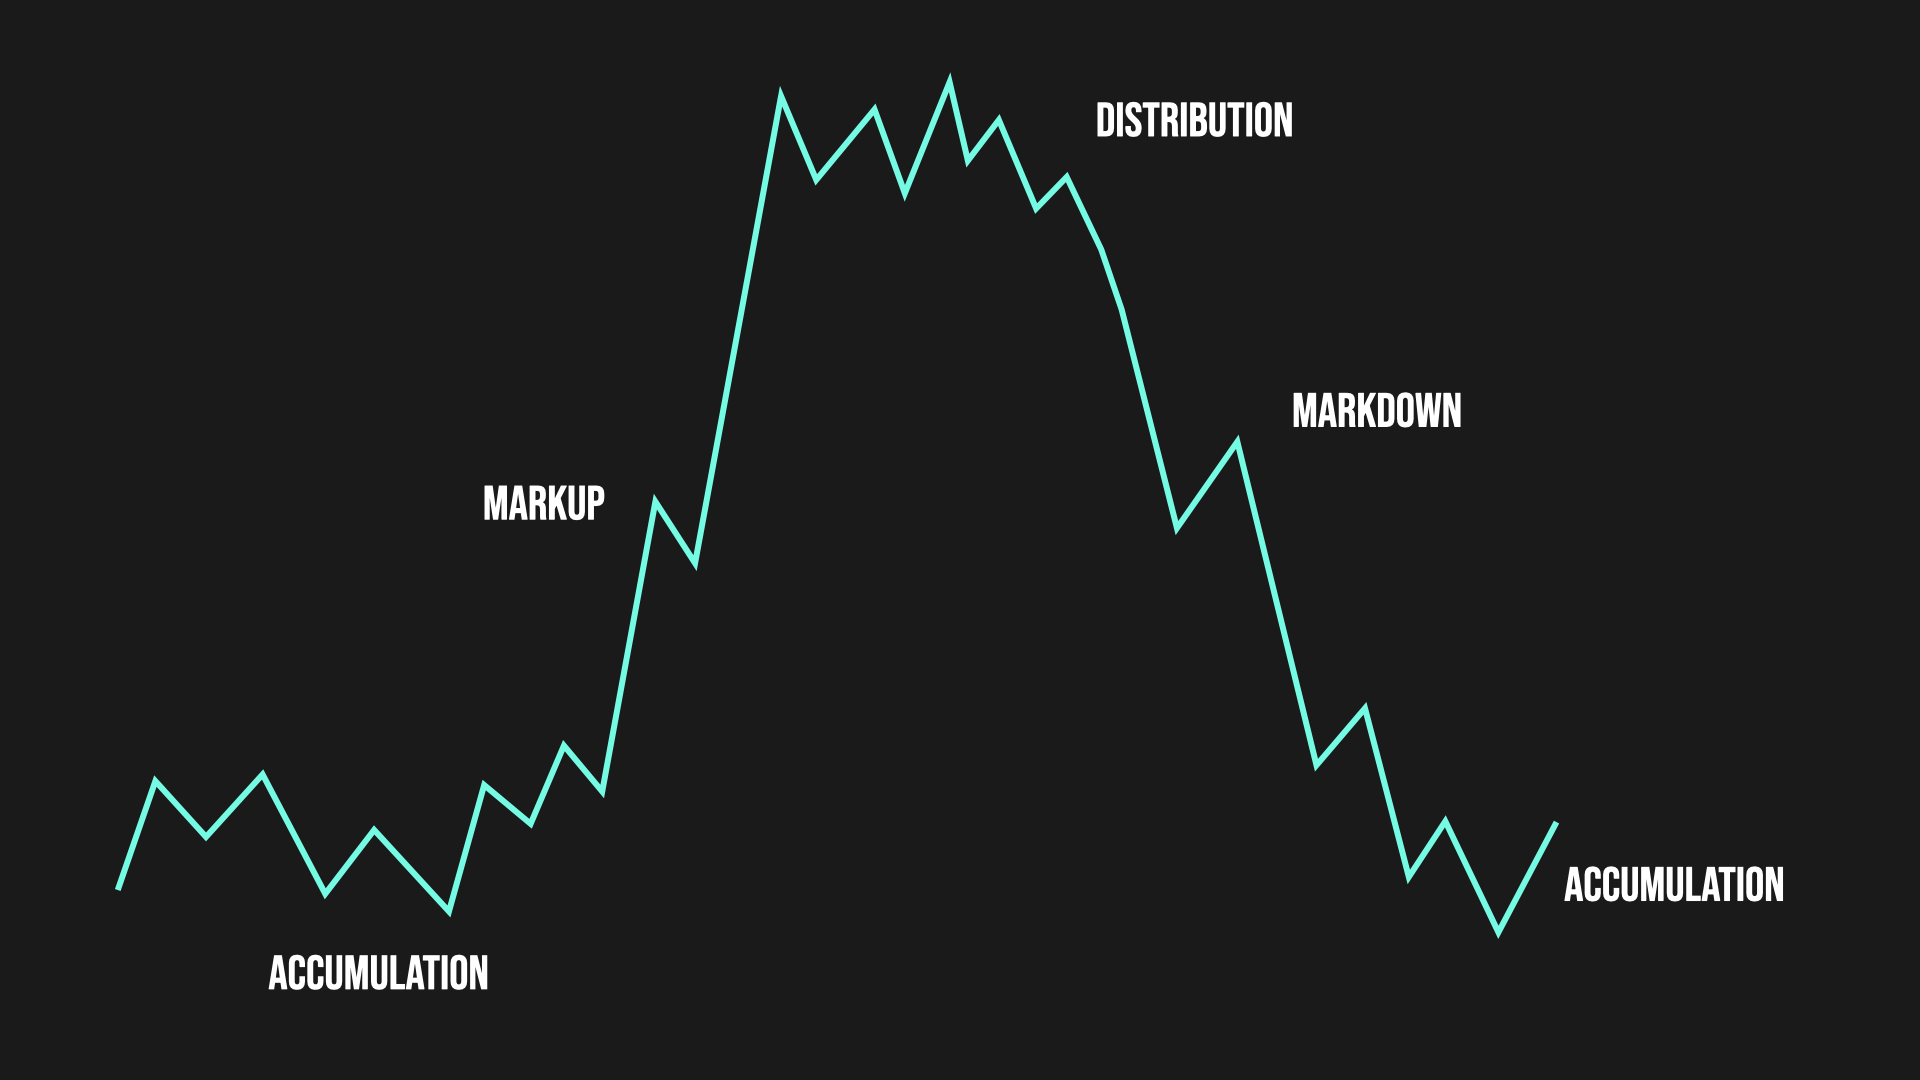
Market phases example
💡 Try this:
Open a chart, spot these patterns. They pop up all the time and act the same way.
🚀 Module 1 Implementation Plan
Time to use this stuff. Every day, check the market, spot biases and traps, plan your trades, then look back at what happened. Nail this before hitting Module 2's techy bits.