
🎯 Key Takeaways
In this module, we're diving into the essential technical analysis skills every trader needs. You'll figure out that it's not about cramming patterns into your head—it's about getting a feel for what the market's actually telling you.
By the end of this, you'll feel good about:
- Getting a handle on the economics that push markets around.
- Spotting real price momentum and exhaustion signals that hint at big moves coming.
- Using volume to double-check what price is up to.
- Taking support and resistance to the next level.
2.1 Essential Economic Fundamentals for Traders
Let's talk about the economic stuff that really shakes up markets. These indicators matter a lot—they can clue you in on what's coming next. Knowing this gives your technical analysis a bigger picture, helping you understand why prices move the way they do.
We can split them into four main groups:
- Inflation Data: CPI, PPI
- Employment Data: Non-Farm Payrolls, unemployment rate, etc.
- Economic Health: GDP
- Monetary Policy: Rate Decisions
Inflation Data: CPI and PPI
Consumer Price Index (CPI) tracks how much prices for everyday things are shifting. If CPI comes in higher than folks expected, markets often get jittery—stocks and crypto might sell off, while currencies could perk up as traders bet on tougher policies. If it's lower than expected, markets usually cheer up, thinking things will ease off.
Producer Price Index (PPI) checks out price changes from the producer's end. It's like an early warning for CPI since companies often pass those costs on to us. When PPI climbs, CPI tends to follow, and markets react in a similar way.
| Consumer Price Index (CPI) | Producer Price Index (PPI) | |
|---|---|---|
| Higher than expected | sell | sell |
| Lower than expected | buy | buy |
Employment Data
Non-Farm Payrolls (NFP) shows how many jobs got added or lost last month, skipping the farming gigs. It hits the first Friday of each month and can really rattle markets. If NFP beats expectations with more jobs, markets might dip, figuring tight policies aren't going anywhere. If it's weaker with fewer jobs, markets often jump, expecting things to loosen up.
Unemployment Rate is just the percentage of folks hunting for work. Lower than expected? Same vibe as a strong NFP—markets might sell off. Higher unemployment hints at trouble, which could mean easier policies and a rally.
Initial Job Claims counts first-time unemployment filings. More claims than expected can drag markets down; fewer is usually a plus.
JOLTS (Job Openings and Labor Turnover Survey) looks at hiring and quitting. Higher than expected puts pressure on markets; lower suggests the job scene's cooling, which might mean a weaker NFP down the road.
| NFP | Unemployment Rate | Initial Job Claims | JOLTS | |
|---|---|---|---|---|
| Higher than expected | sell | sell | sell | sell |
| Lower than expected | buy | buy | buy | buy |
Economic Health: GDP
Gross Domestic Product (GDP) is the total value of everything a country churns out. It's a big deal, but here's the thing: it comes out late and gets tweaked a bunch. By the time we see it, the economy might've moved on. Still, it can nudge markets, so don't sleep on it.
Monetary Policy: Rate Decisions
Interest rate moves are massive. Central banks like the Fed tweak rates to keep prices steady and growth humming. When rates go up, markets often turn gloomy—higher borrowing costs hit stocks and crypto hard. Rate cuts? That's like a green light, making borrowing cheaper and lifting markets.
What the Fed hints about future rates, called forward guidance, matters just as much as the decision itself. Markets go wild over clues about what's next.
| Rate Decision | Market Reaction |
|---|---|
| Rate Hike | sell |
| Rate Cut | buy |
| Bearish Guidance (hawkish) | sell |
| Bullish Guidance (dovish) | buy |
Economic Phases
The economy rolls through phases that tie into market ups and downs, like the accumulation and distribution stuff from Module 1. Here's the rundown:
- Expansion (Markup market phase)
- Solid GDP, fewer jobless folks, more spending.
- Markets usually shine.
- Policies tighten up a bit to keep things from overheating.
- Peak (Distribution market phase)
- Inflation's creeping, jobs are tight.
- Markets get wobbly.
- Big rate hikes to cool things off.
- Contraction (Markdown market phase)
- GDP shrinks, unemployment climbs, spending slows.
- Markets tank.
- Rate cuts to get things moving again.
- Trough (Accumulation market phase)
- Economy hits bottom, unemployment maxes out, inflation eases.
- Markets start picking up.
- Policies shift with cuts or hikes.
With this econ know-how, you're not just guessing at charts—you've got the why behind the moves. Like, in a contraction, chasing bullish breakouts might be dicey; shorting them could fit better with the bearish mood. That's why keeping tabs on these releases is a game-changer.
💡 Try this:
Dig into the last six months of big economic releases. Jot down what people expected, what actually happened, and how your go-to assets reacted. Then, sketch out a plan for how you'd trade these events based on what you learned.
2.2 Price Momentum and Exhaustion Signals
Figuring out when markets are revving up or winding down is a big deal for trading smart. Let's walk through how to catch these vibes.
Identifying Early Momentum
Nailing momentum early can set you up with sweet entries and solid risk-to-reward plays. It often sneaks in with little hints most folks miss, like volume shifts, breakouts from ranges, or price tightening up before a leap.
Take this: When price hangs in a range and volume drops, traders aren't jumping in. If it starts slipping with LOWER lows and highs inside that range, a breakdown might be coming. Catch it early, and you can short at a prime spot, aiming for the range's bottom.
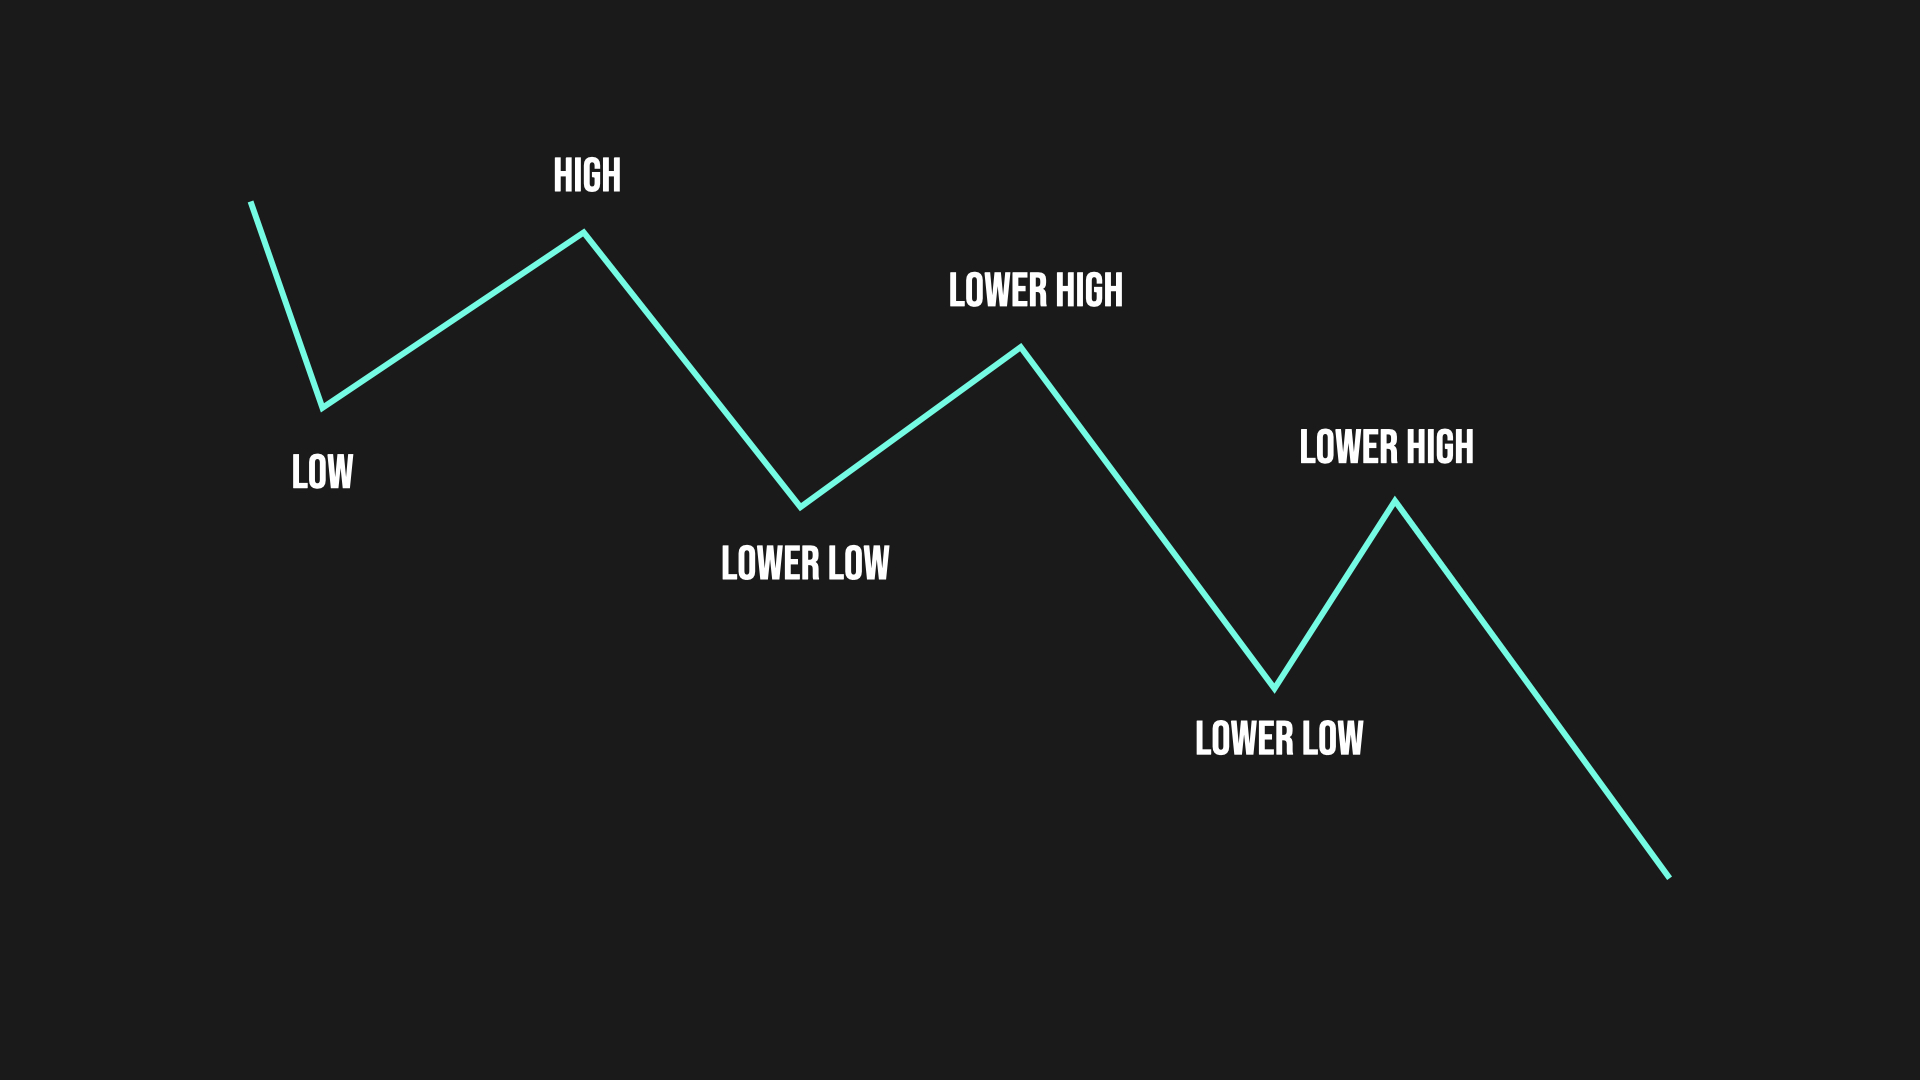
Example of price weakening
See that chart? Price is trending down in the range—early sign it's weakening. Check volume too: if buying's fading, shorting looks good. Flip it for an upside move—higher lows and highs mean strength. Always peek at volume to back it up, like we covered in Module 1.
Exhaustion Recognition
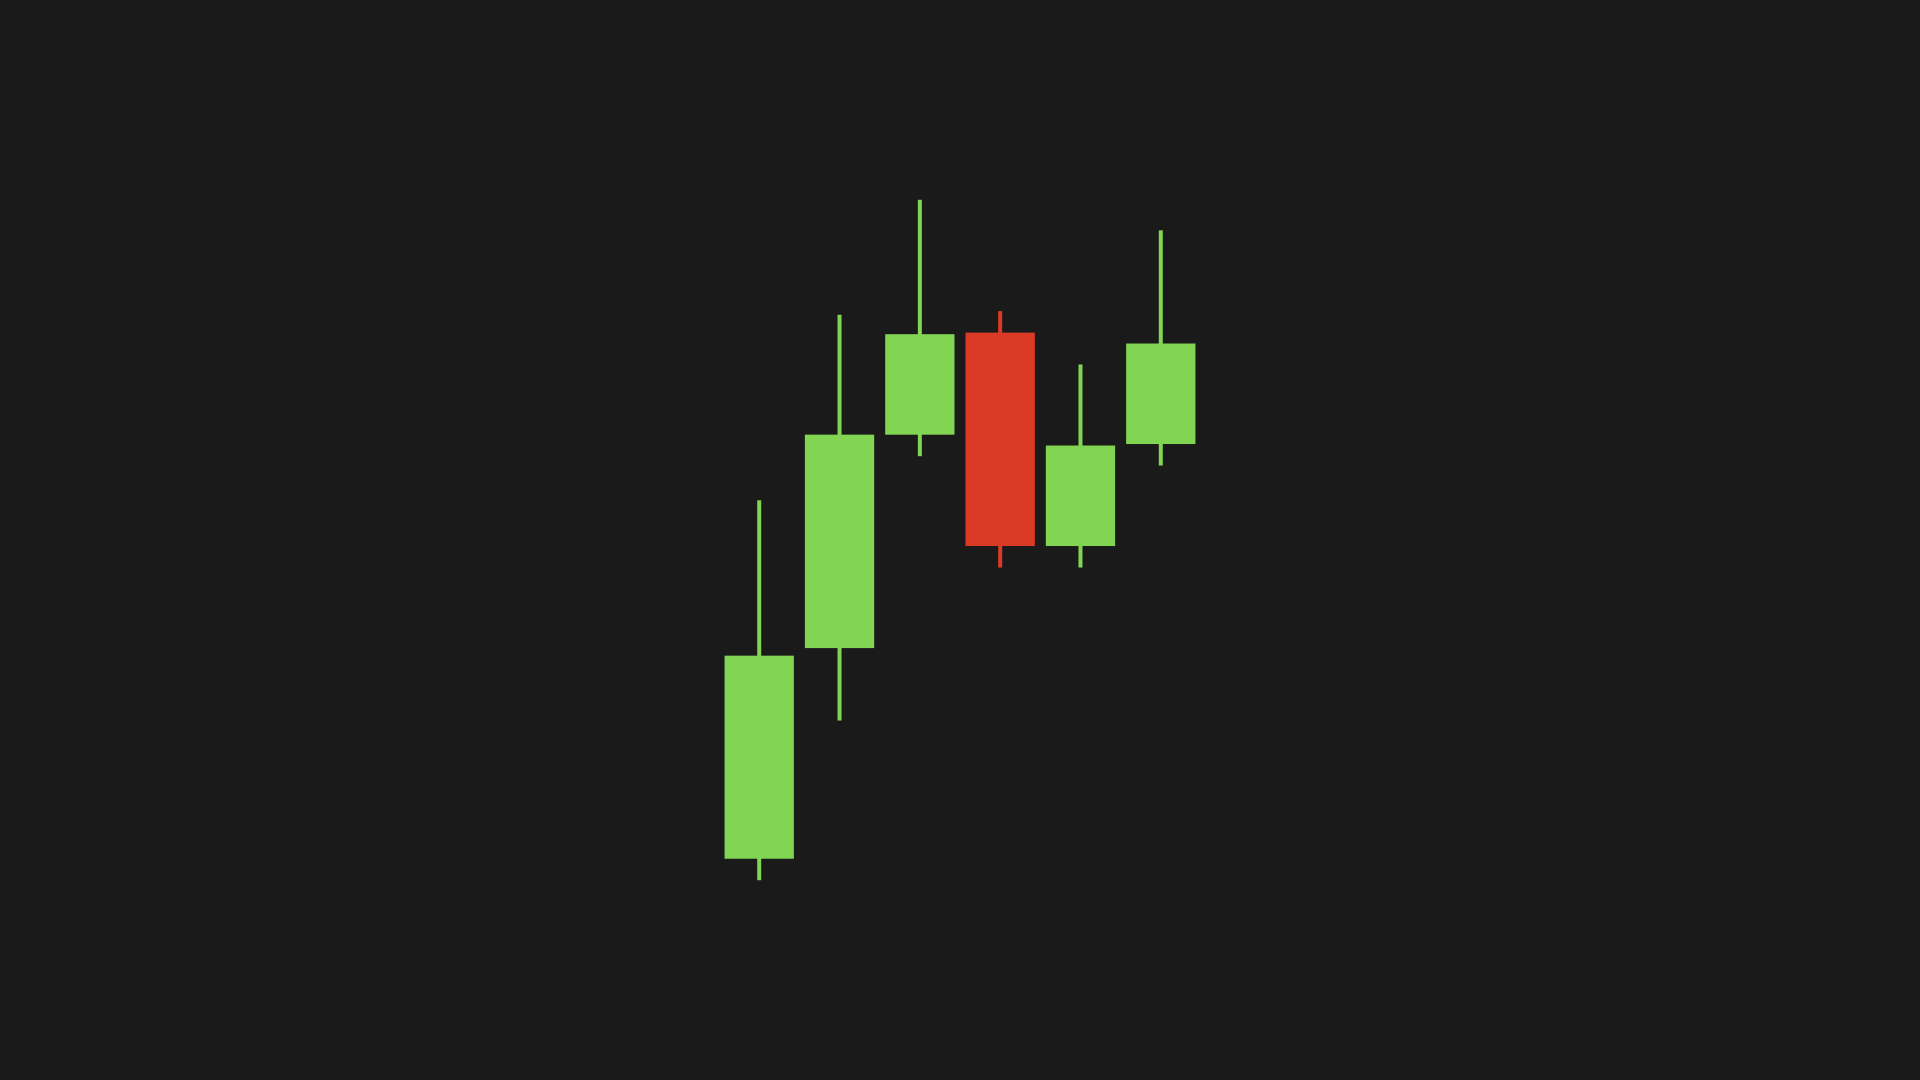
Uptrends don't run forever. Watch for clues it's slowing down—smaller green candles, lighter volume, price barely hitting new highs. It's like someone running out of steam—they slow, stumble, then stop.
When these signs pile up, the uptrend's probably done. You could gear up to short or wait for a dip to buy cheaper. It's like holding off for a deal!
Price Velocity Analysis
Price velocity is how fast prices are moving, like a speedometer. Fast moves mean something's cooking—traders are hyped or spooked.
Why it's handy:
- Market mood: Quick shifts show strong emotions—belief or panic.
- Risk management: Fast action might need wider stops to stay in the game.
- Spotting fakes: A sluggish breakout? Probably not legit.
Pair velocity with volume for the win. A speedy breakout with big volume often keeps rolling. A slow, quiet one? Likely a bust. It helps you pick winners.
2.3 Volume Analysis with Price
Volume Confirmation Principles

When prices climb and volume's up, that's legit—people are buying in. Same for drops: falling prices with heavy volume mean sellers mean business. But if prices shift with low volume, careful—those moves can flip fast. This price-volume combo helps you sort real trends from noise.
Heads up: When price breaks a big level with high volume, it's got legs. Also, if volume quiets down while price drifts sideways, a breakout's brewing. More volume with the trend, more trust in your trades.
Volume Divergence Signals

Sometimes price and volume don't jive—that's divergence. If price keeps rising but volume's dropping, it's a warning—like a party thinning out. The uptrend might be fading. Or if price falls but volume shrinks, sellers might be tapped out, hinting at a bounce.
Catching these gaps lets you jump on turns early. It's even stronger with other clues, like puzzle pieces clicking.
Volume Profile Analysis

Volume Profile's like a trading map, showing where the action's been thick. Those busy spots often turn into support or resistance later. Knowing where the crowd hung out helps you plan entries and exits since price tends to react there.
2.4 Support & Resistance
Let's build on the support and resistance basics from Module 1.
Dynamic S&R (Ichimoku Cloud)

The Ichimoku Cloud moves with the market, unlike fixed levels. It gives you a bunch of spots to watch and even looks ahead, which is neat. I stick to the cloud part—keeps it simple. It shines in trends, less so when things are flat.
Order Blocks & Gaps
Order blocks are zones where big trades kicked off sharp moves. They can hold as support or resistance later—big players might still be lurking there. Gaps are empty price zones that pull price back to "fill" them.
Mix these with volume to see how strong they are.
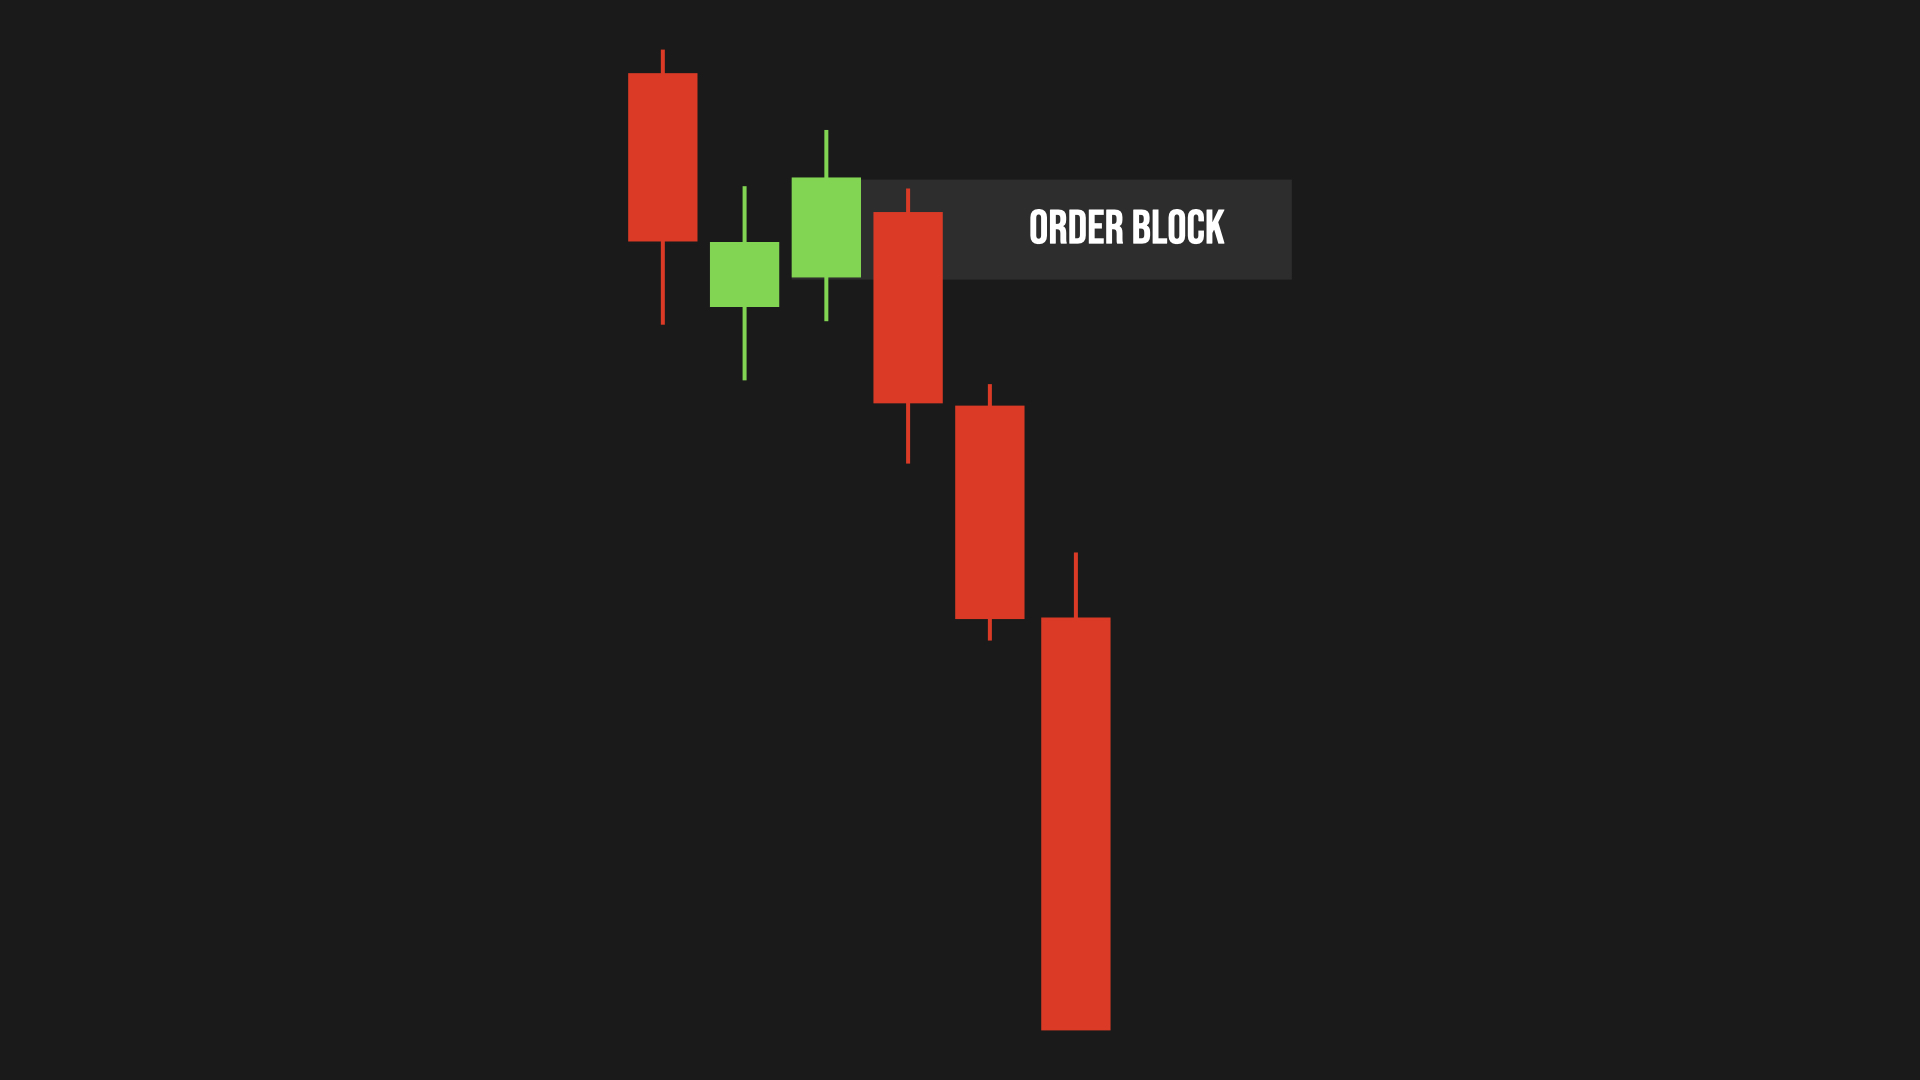
Order block example: last opposite candle before big swing
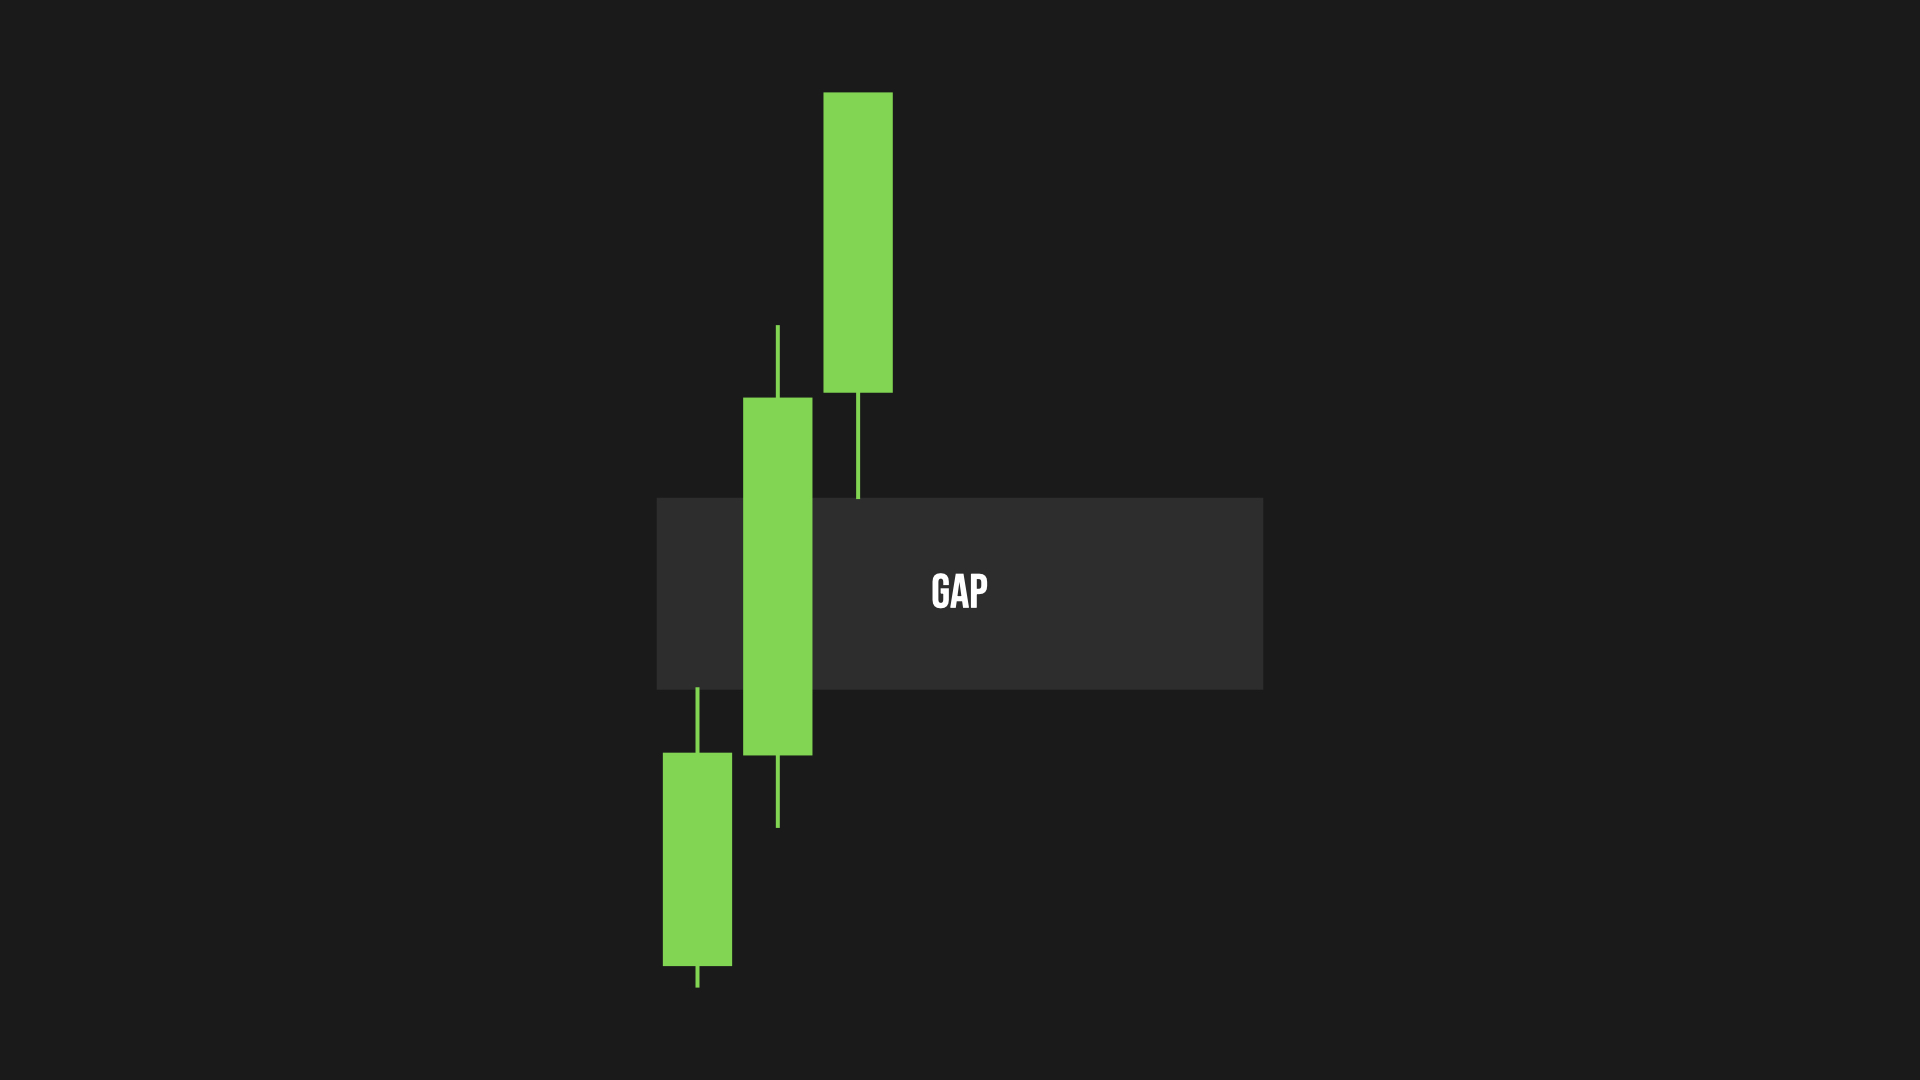
Trading gap example: three candles charging same direction
💡 Try these:
- Momentum and Exhaustion: Pick a recent trend in your market. Use volume, velocity, and candles to spot momentum and exhaustion. Note when you'd jump in or out.
- Volume & Price: Check big moves on your favorite asset. Did volume back it up or not? What'd that tell you?
- Volume Profile and S/R: Use a volume profile to find key levels in a range. Mark them as support or resistance and see how price played them.
- Ichimoku Cloud: Slap the cloud on your chart. Spot where it held as support or resistance. Add order blocks and gaps to guess what's next.
🎓 Closing Off
You've laid down a strong base here. You're not just eyeballing charts anymore—you've got the scoop on how economics, momentum, exhaustion, and volume all tie in. That's your edge for sharper trades.
Technical analysis isn't about fortune-telling—it's about hearing the market out and acting smart. Keep practicing these tricks, and you'll handle tough markets like a pro.
Take your time with the exercises, play around with what you've learned, and I'll catch you in the next module!